Mapping Russia’s Arctic Hydrocarbon Development Scheme
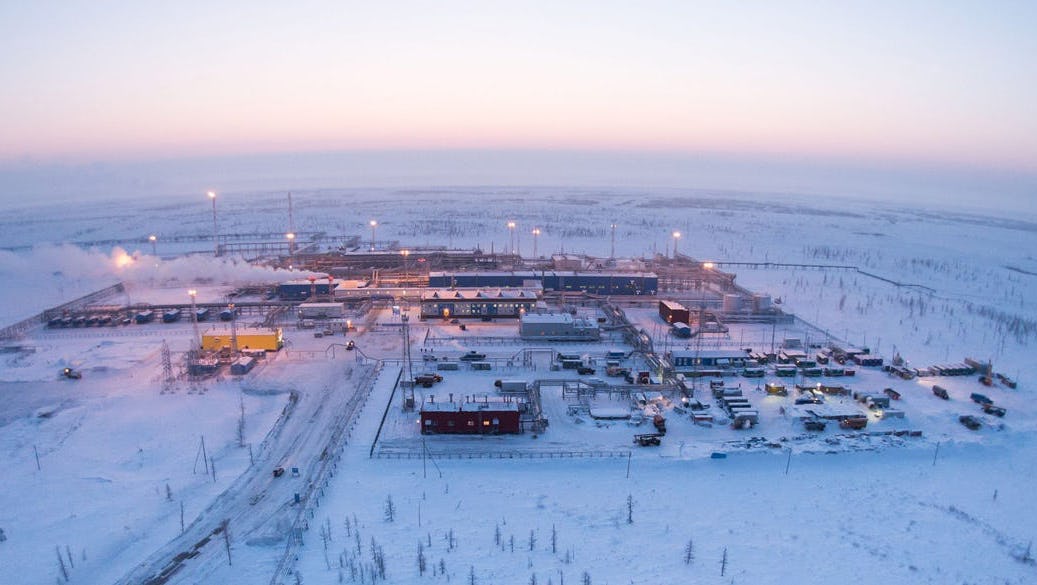
Russia’s Zapolyarnoye natural gas field on the Gydan Peninsula in 2016. Photo: Gazprom
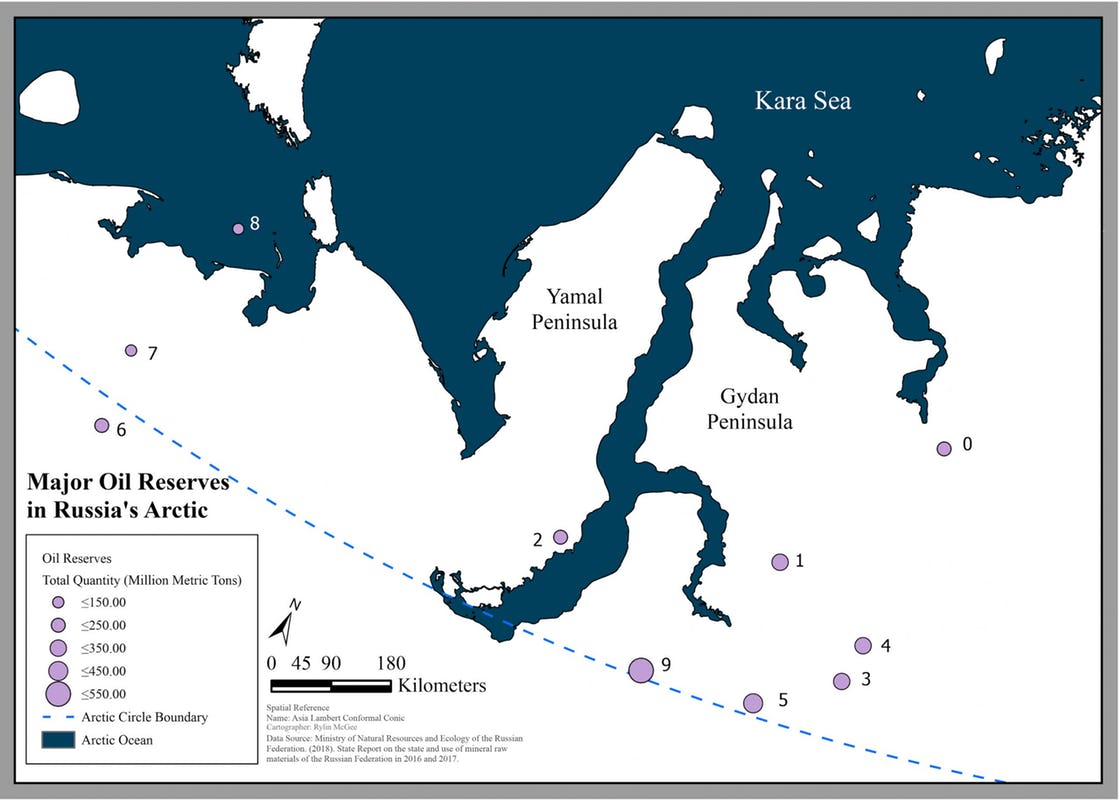
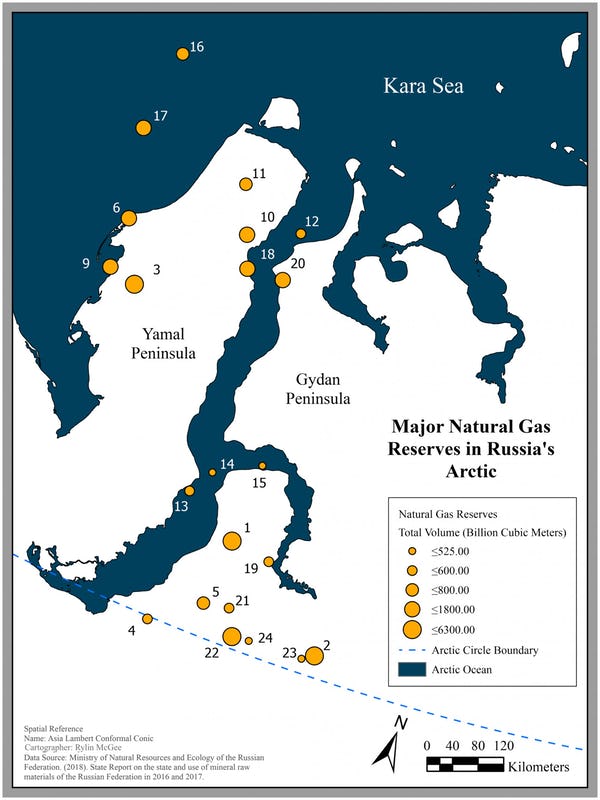
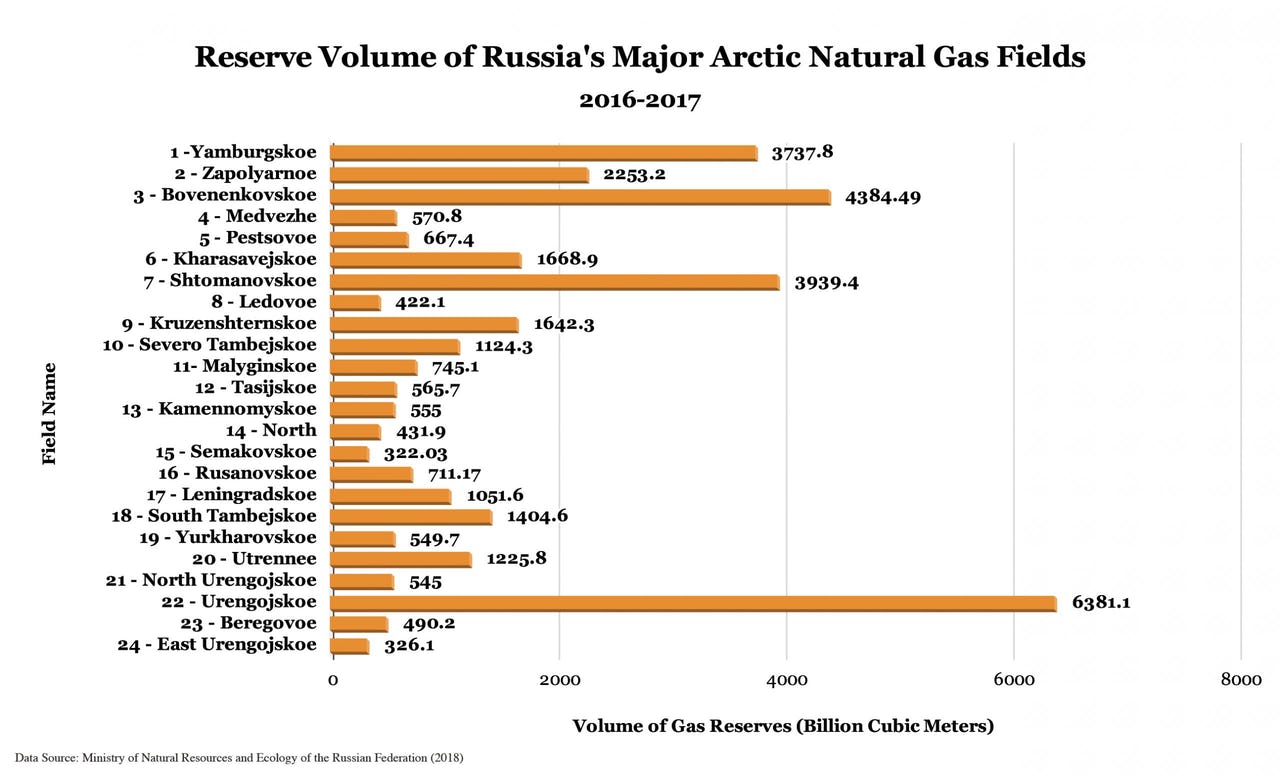
Globally, climate change presents major implications for hydrocarbon development and is especially relevant in the Arctic, where surface air temperatures warm at approximately twice the global rate.1) In the past five decades, Arctic regions saw downward trends in sea ice levels and snow cover extent, increased permafrost thaw, and an intensified hydrological cycle resulting from warming air temperatures.2) The Arctic is also one of the world’s most significant and extensive regions of untapped oil and gas. The Russian Arctic alone comprises over 35,700 billion cubic meters of natural gas (Figures 3 & 4) and over 2,300 million metric tons of oil and condensate (Figures 1 & 2) with the majority concentrated in the Yamal and Gydan peninsulas.3) However, successful hydrocarbon industries depend not only on resource reserves, but also on physical infrastructure, political structures and environmental context.4)5) Thus, fossil fuel development must be considered in relation to the complex entanglement of local firms, extraction sites and distribution systems which connect local resources to global markets, as well as the unique Arctic environments and global climate in which such networks are spatially embedded.
Concurrent with changing global temperatures, Russian President Vladimir Putin used the Fifth International Arctic Forum as a platform to announce Russia’s intentions to continue expanding its network of fossil fuel activity. Over the next decade and a half, Russia’s Arctic development strategy will focus on expanding fossil fuel extraction in Russia’s Arctic regions and developing the Northern Sea Route as a primary means of distributing extracted hydrocarbons to market.6) In particular, Russia’s resource distribution network and centralized state control play key roles linking local production to global consumption. Specifically, Russia relies on over 10,000 kilometers of pipeline and its re-emerging Northern Sea Route (NSR) to bring Arctic hydrocarbons to consumers in the East and West.7) As warming temperatures create ice-free or weakened ice corridors, the NSR has increasingly allowed Russia to realize its Arctic economic potential (Figure 5).8) In 2019, the volume of traffic shipped by nuclear icebreakers on the NSR reached 30.28 million tons.9) With increased infrastructural and technological investment, Russia seeks to reach 80 million tons by 2024.10) To complement such growth, Russia also plans to operate thirteen heavy-duty linear icebreakers by 2035, nine of which will be nuclear powered.11)
While investment in Arctic ports, infrastructure and technology allow Russia to expand its fossil fuel distribution network, dynamic geographic factors and environmental conditions such as climate, sea ice, sea levels, permafrost and remoteness also influence Russia’s Arctic hydrocarbon landscape and emerge as key constraints to fossil fuel development at local, national and global scales. Thus, such factors must also be considered when attempting to understand the spatial network of Russia’s developing Arctic hydrocarbon landscape. With large implications for the global environment and international markets, it is important to understand the current state of the Russian Arctic oil and gas industry. However, doing so requires us to consider the multidimensional and spatially-embedded series of networks which define Russia’s Arctic hydrocarbon development activities. Building upon Stephenson and Agnew’s (2015) work12) discussing Russia’s Arctic oil and gas sector in relation to network theory, the maps below provide visual representations of Russia’s Arctic fossil fuel network and reveal the spatial configuration of the region’s development activity, as well as how the interaction between local, regional, and global fossil fuel networks are both territorial and trans-boundary in nature.
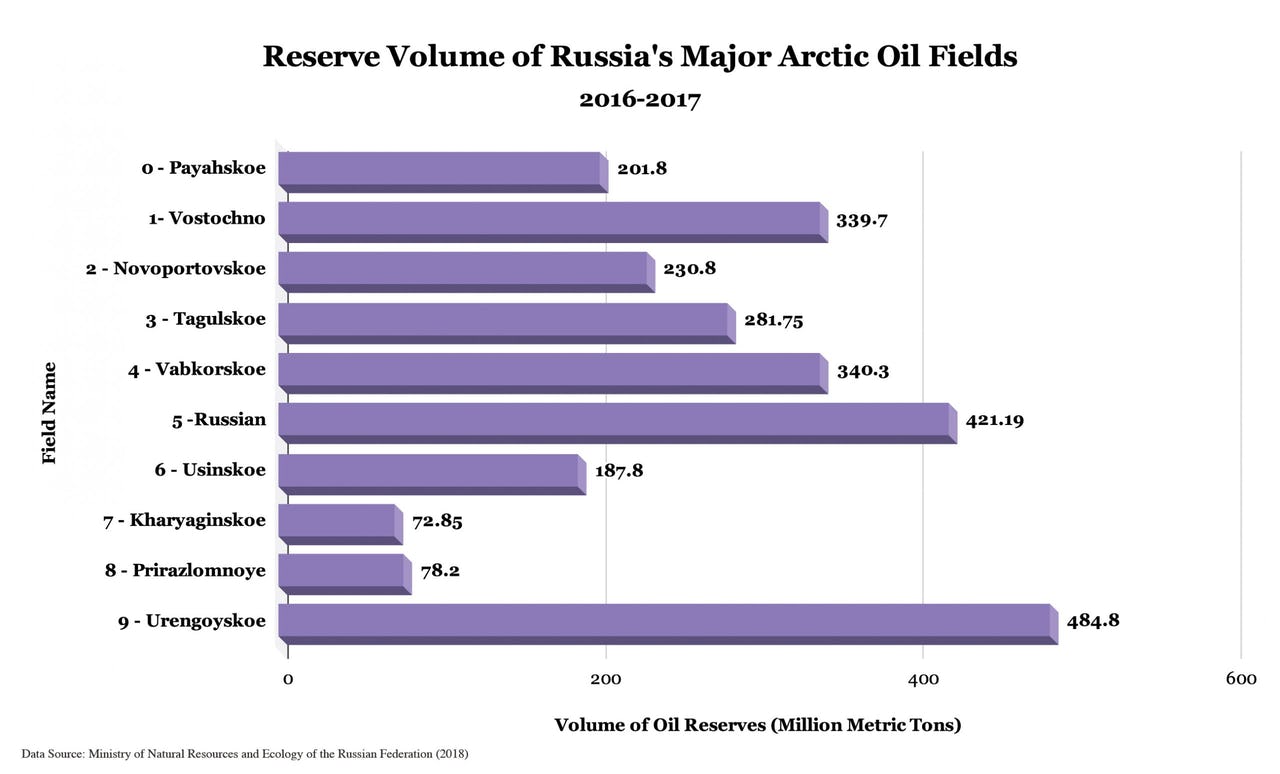
Oil & Gas: The primary data source used in the creation of Figures 1-6 was the Russian Ministry of Natural Resources “State report on the use and state of raw materials of the Russian Federation,”13) which provided a catalog of Russia’s major oil and natural gas fields and data on the total estimated volume of oil and gas reserves at each field site, as well as project information provided by Gazprom14) and Novatek15). Occasionally, external news articles, videos and maps were cross-referenced, validating findings.
Pipelines & NSR: This research focused only on Arctic pipelines, which will play a critical role in Russia’s fossil fuel development strategy. These pipelines were mapped by digitizing and georeferencing imagery provided by Gazprom16) For fields relying on the NSR to ship hydrocarbons to market, McGee analyzed project information provided by Gazprom17), Novatek18) and the Russian media, as well as data from Russian state-owned company Rosatom.19) The World Port Index20) was used to geolocate Russian ports used to transport Arctic hydrocarbons, as well as Google Earth Imagery for identifying ports not included in the index. Some smaller Arctic oil and gas fields and local pipelines were not included in the analysis.
Permafrost & Sea Ice: McGee downloaded sea ice extent data directly from the National Snow & Ice Data Center21) and permafrost extent data from the Russian Academy of Science.22)
Territory and Network Dynamics
Mapping Russian Arctic hydrocarbon development reveals the multiscalar and multidimensional character of the industry’s various networks, as well as the dynamic interplay existing between territory and network. Specifically, Figures 1 and 3 reveal the spatial embeddedness of Russia’s Arctic upstream fossil fuel activities, in which resources and local extractive firms are grounded and dependent upon the availability of accessible, resource-rich sites centrally located on the Yamal and Gydan peninsulas. In this context, Arctic hydrocarbon development is contingent upon regional availability, thus taking on a fixed territorial character.23) However, Figure 5 also reveals how Russia’s Arctic hydrocarbon industry transcends boundaries to operate in a fluid and relational sense, as transportation and distribution networks connect local and regional resources to global markets.24) Physical infrastructure including Arctic pipelines, shipping ports, oil and gas tankers, icebreakers and the NSR (Figures 5 and 6) all uphold larger global production networks, linking localized economies to agglomerate ones and are therefore critical to network connectivity.25)
Spatial Embeddedness and Changing Environmental Conditions
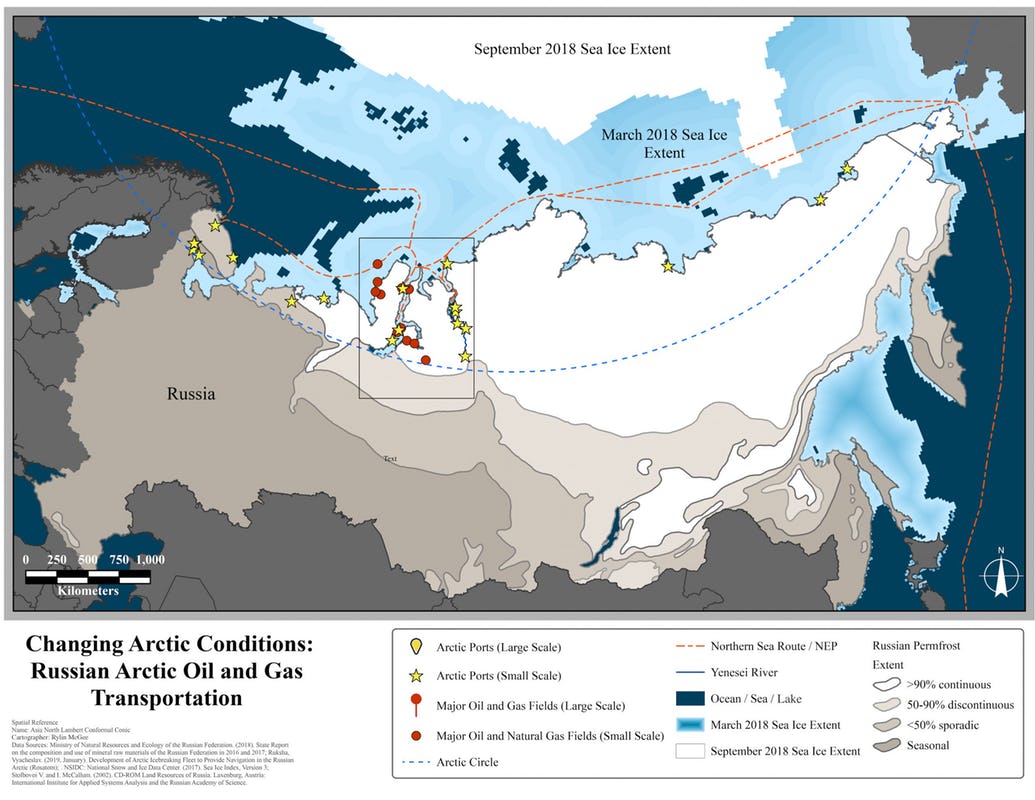
Visualizing Russia’s Arctic fossil fuel development scheme reveals its spatially-embedded character, as changing Arctic environmental conditions such as permafrost thaw, melting sea ice extent, and rising sea levels closely influence the direction and development of regional activities (Figure 5). According to the Arctic Climate Impact Assessment (ACIA) program, the area of permafrost in the northern hemisphere will decrease 10 to 18% by 2030; 15 to 25% by 2050; and 25 to 50% by 2080 due to climate change.26) This means normally frozen regions will begin to thaw and recede, increasing the risk of accidents involving hydrocarbon infrastructure built in permafrost regions. As shown in Figure 6, many pipelines in Russia’s Arctic are built on full or partial permafrost zones, making them susceptible to soil expansion and recession and thus damage with high repair costs and extensive environmental impacts. Here, the stability of Arctic pipelines and Russia’s ability to connect local resources to global and primarily Western markets will be heavily influenced by future permafrost conditions. Sea ice conditions, which vary on seasonal bases, also pose a challenge. While state-owned corporation Rosatom will develop icebreakers to support Russia’s targets for NSR export volumes, current conditions and sea ice variability render investment by many shipping firms unprofitable, due to limited navigability windows, icebreaker fees, insurance costs and other economic factors associated with Arctic maritime operations.27) Further, sea level rise in coastal regions presents the risk of erosion and flood damage, threatening infrastructure and key ports. Thus, the functioning of Russia’s primary means of distributing LNG to eastern markets depends upon the ability of infrastructure and technology including tanker terminals, nuclear icebreakers and Arctic ports to withstand and overcome environmental factors. Figure 5 reveals the degree to which Russia’s NSR is embedded in and contends with this changing environment.
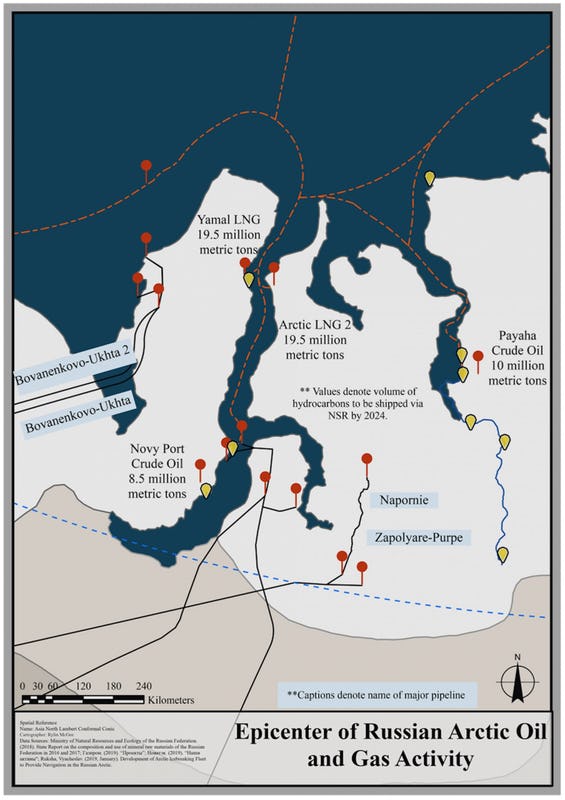
Russia’s hydrocarbon and NSR development scheme also exacerbates the very environmental changes which influence the realization of such ventures. Locally, emissions from shipping including black carbon intensify warming effects in already climate-sensitive Arctic regions, and the global consumption of Russian fossil fuels will intensify climate change impacts in regions extending beyond the Arctic.28) Therefore, Russia’s Arctic fossil fuel development scheme (Figures 1-6) must also be considered in relation to the geographic redistribution of emissions which will occur within the global fossil fuel network, as well as in relation to the resulting climate-induced economic costs and opportunities which will arise across the globe as a result.29)
Conclusion
Viewing each map in relation to one another, Russia’s Arctic fossil fuel resources, infrastructure, transportation schemes, and environmental conditions interact with one another to form a complex series of networks which will continue to establish themselves in Russia’s Arctic and beyond, especially as the state continues to invest in the fossil fuel industry. In particular, Russia’s Arctic development strategy will stimulate investment in physical, midstream fossil-fuel distribution infrastructure and strengthen the connection between both local and global economies, as well as upstream and downstream fossil fuel activity. This in turn reinforces the connection between political and spatial networks. Thus, as Stephenson and Agnew30) underscore, the dynamism of political, social and physical geographies surrounding the Arctic extractive industry will continue to change the future functioning of networks embedded within them, especially as Russia continues to expand its fossil fuel economy in a warming world.
References