TATW Map of the Months 2025
The Arctic Institute Map of the Month Initiative
Maps provide a useful means of understanding the various ways a region can be understood depending on the industry, discipline, culture or individual. Further, maps allow for the visualization of development and change in a region. Thus, the purpose of our TATW Map of the Month initiative is to highlight the various ways our changing Arctic can be visualised, by showcasing maps created by various geographers, cartographers and organisations around the world. Maps selected for each month reflect a relevant finding or event related to Arctic geography. TATW Map of the Month maps were not be created by The Arctic Institute, but rather shared with permission from the owners in order to make Arctic-related maps more accessible. Check out our 2025 TATW Maps of the Month below.
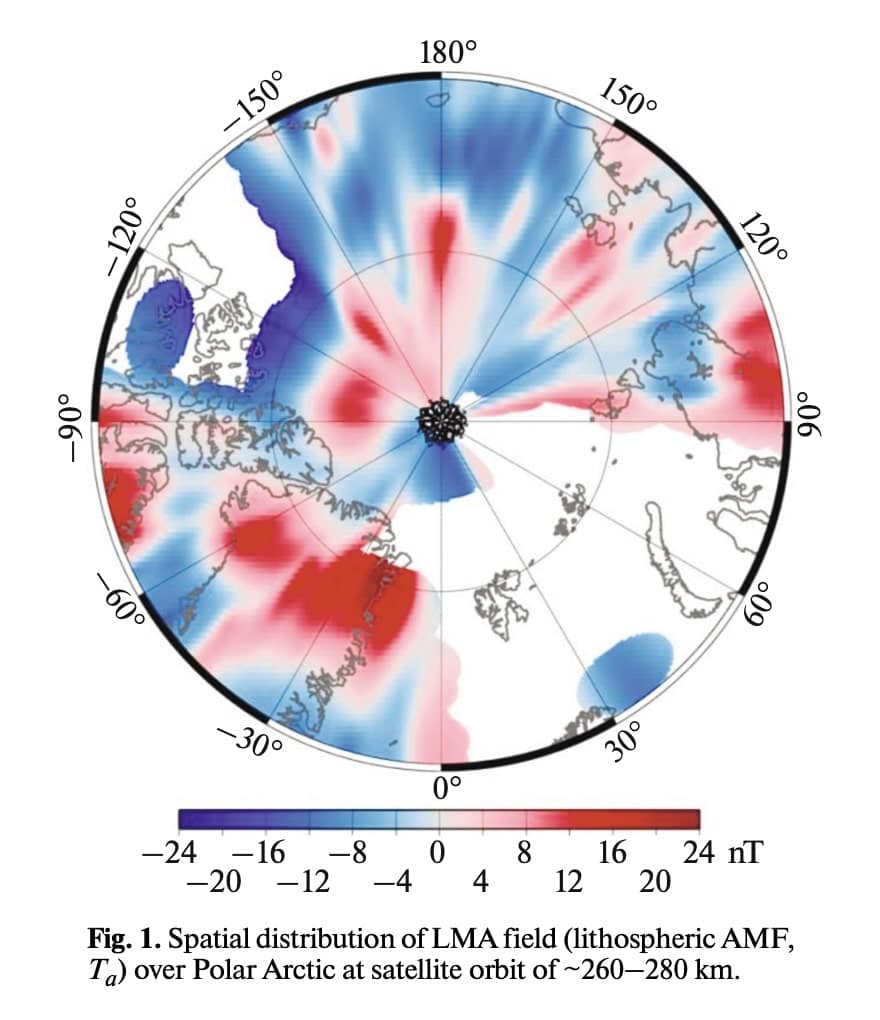
Lithospheric Magnetic Anomalies of the Polar Arctic (Map of the Month January 2025)
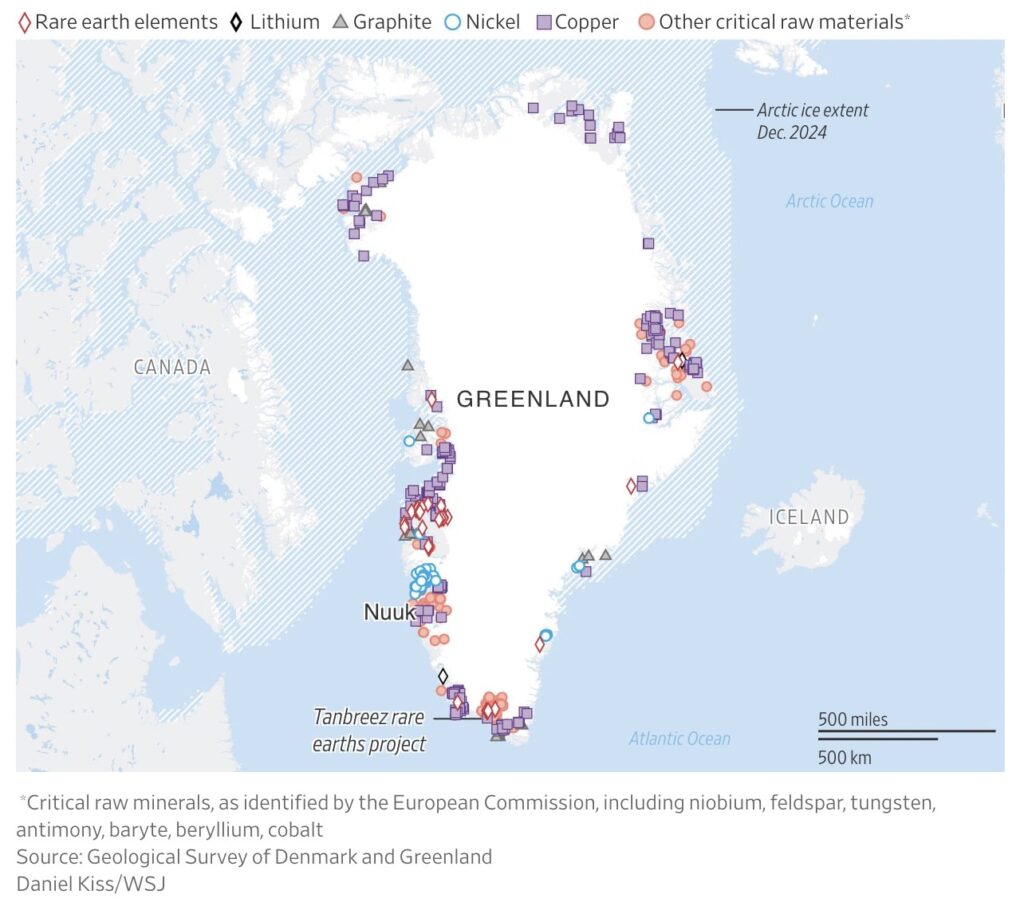
Location of critical raw minerals in Greenland (Map of the Month February 2025)
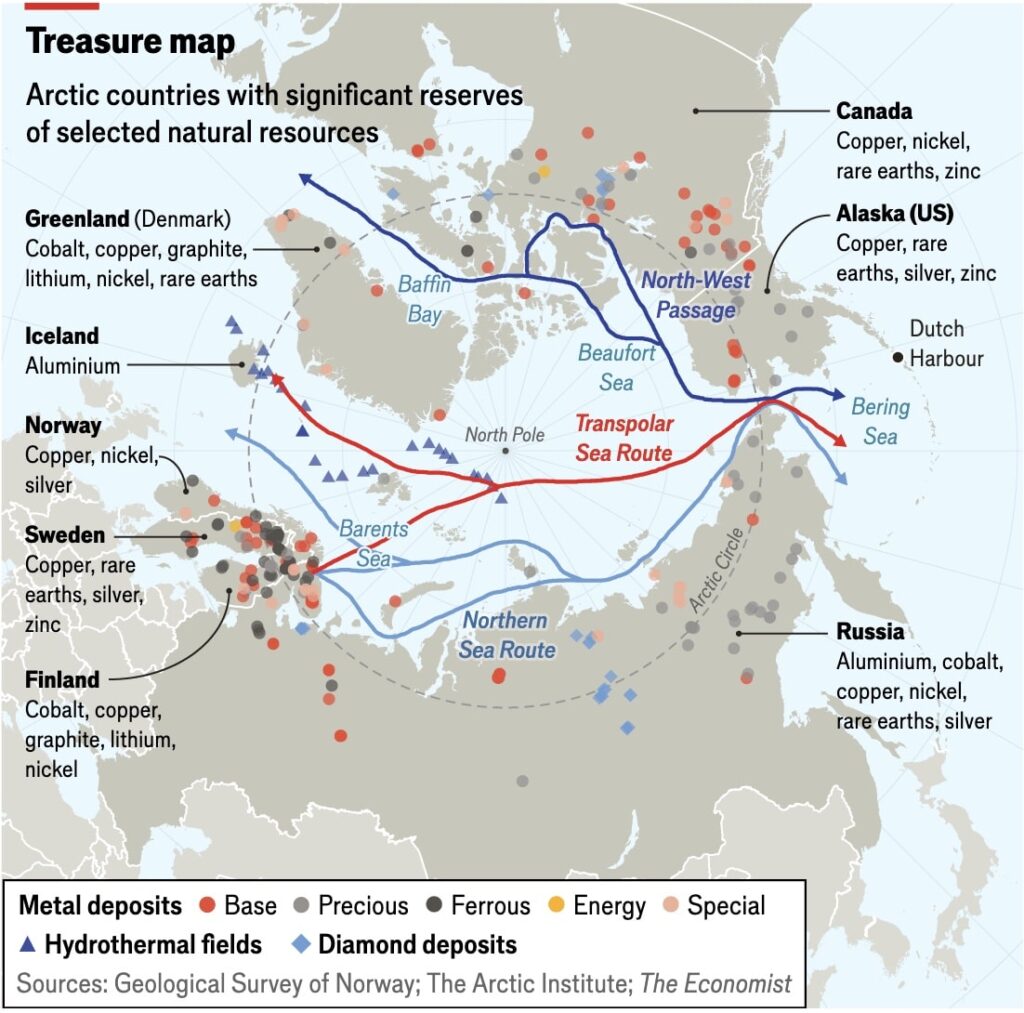
Selection of Arctic countries’ ‘green’ natural resources (Map of the Month March 2025)
2025 Greenlandic general election (Map of the Month April 2025)

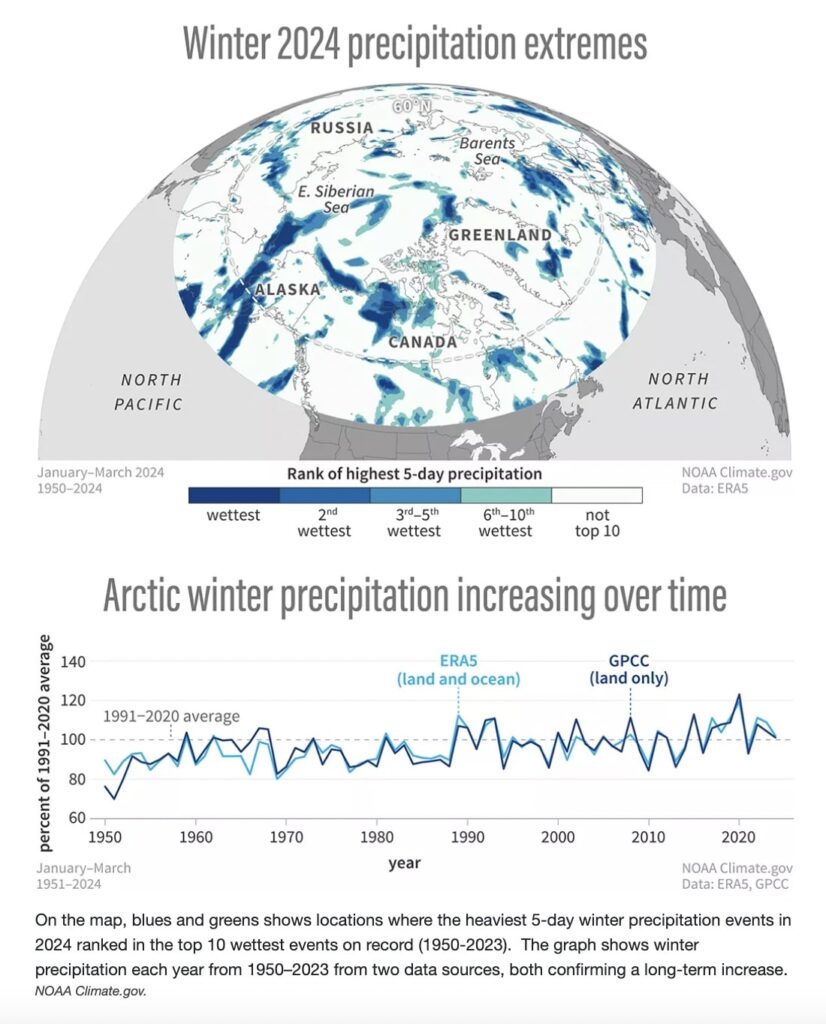
2024 Arctic winter precipitation highs (Map of the Month May 2025)
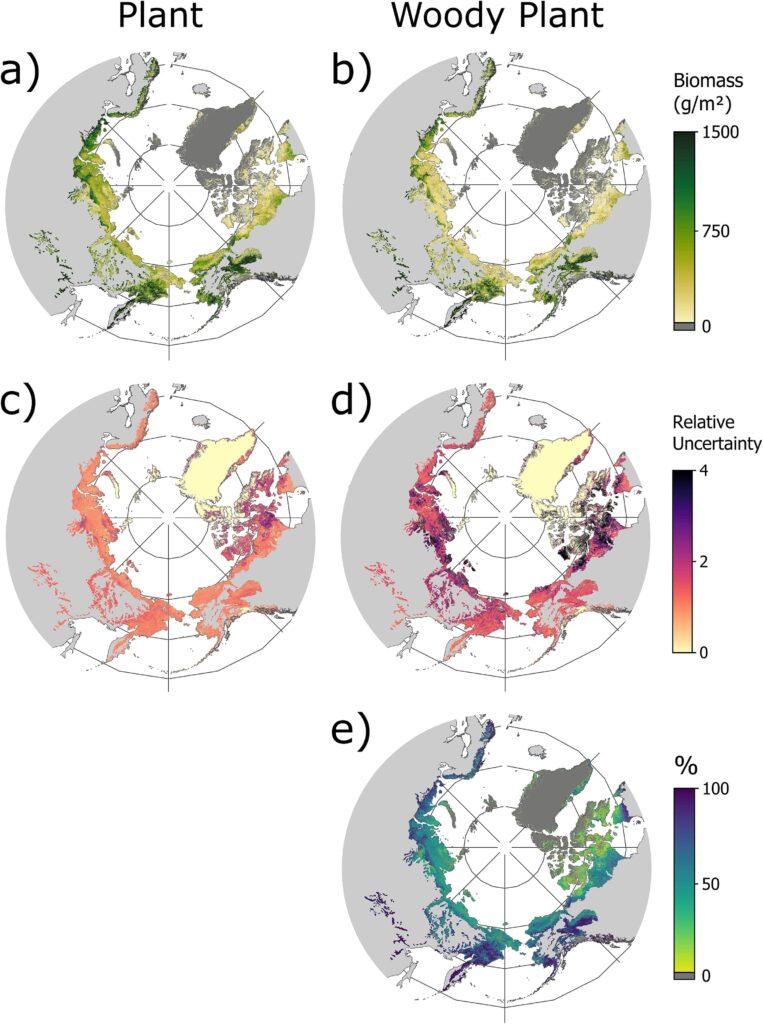
Next generation Arctic vegetation maps (Map of the Month June 2025)
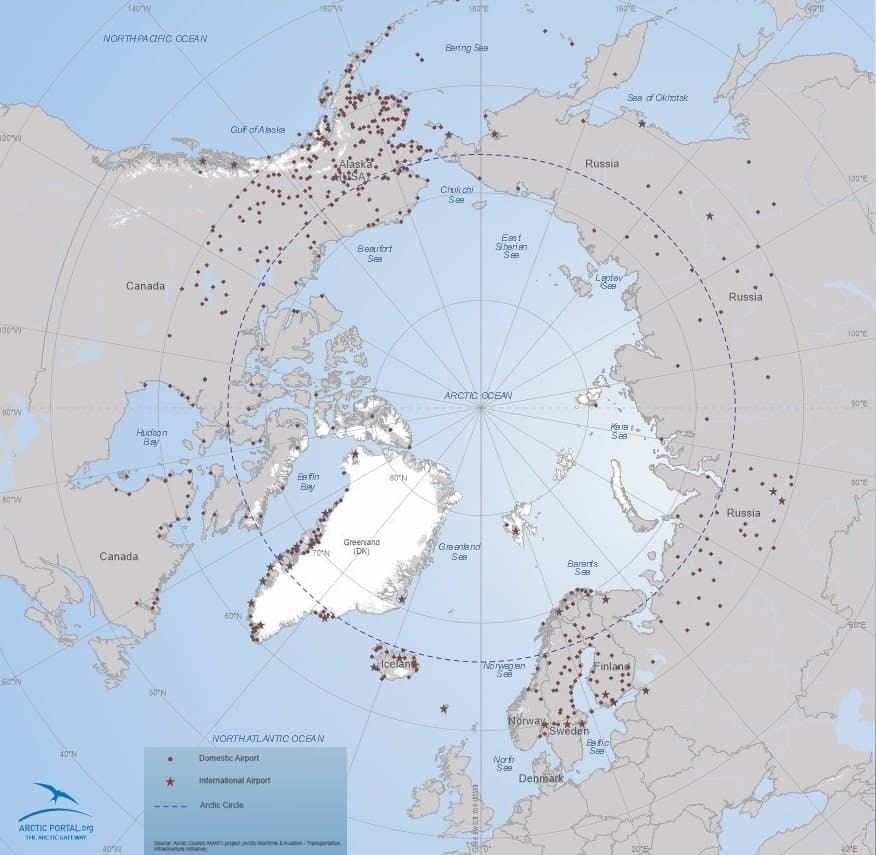
Airports in the Arctic (as of August 2023) (Map of the Month July 2025)
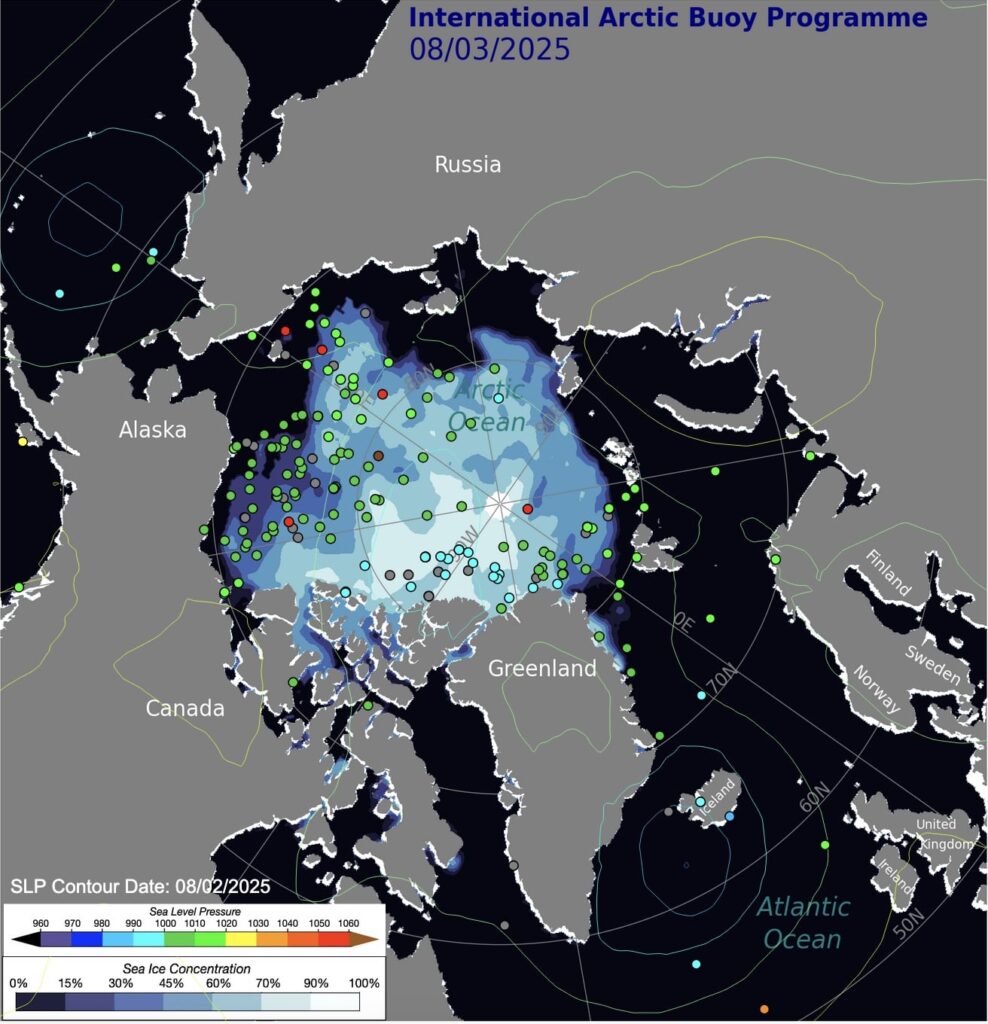
Arctic sea level pressure (Map of the Month August 2025)
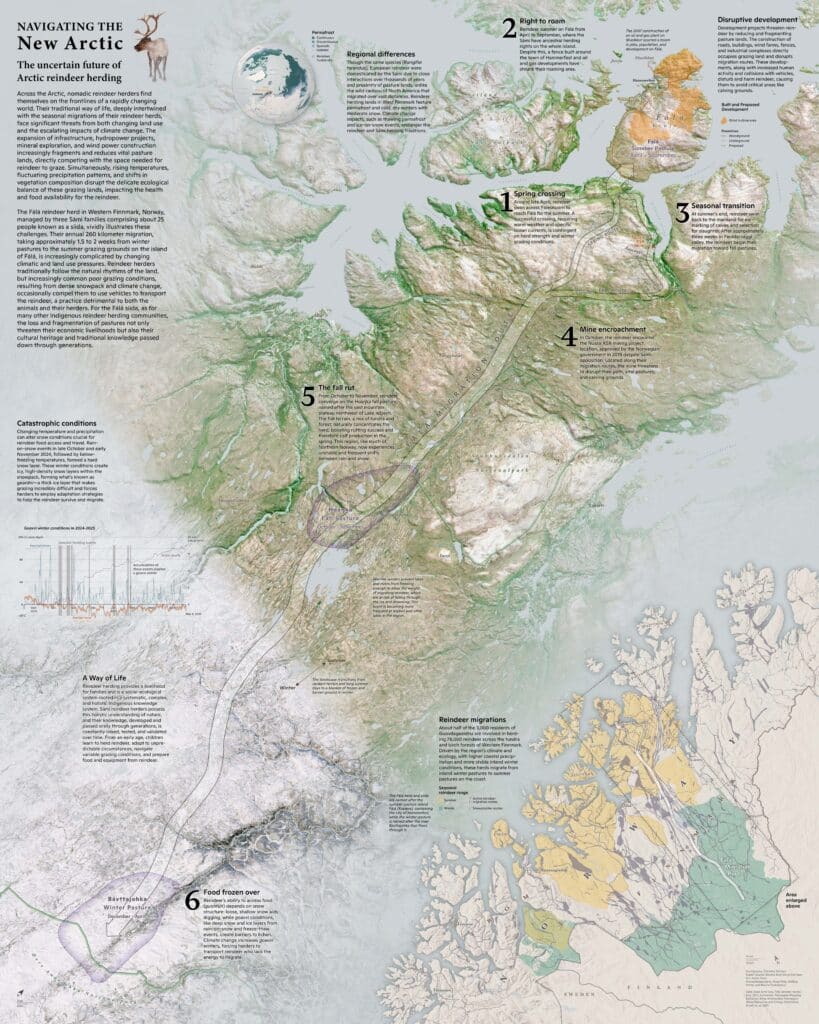
The uncertain future of Arctic reindeer herding (Map of the Month September 2025)
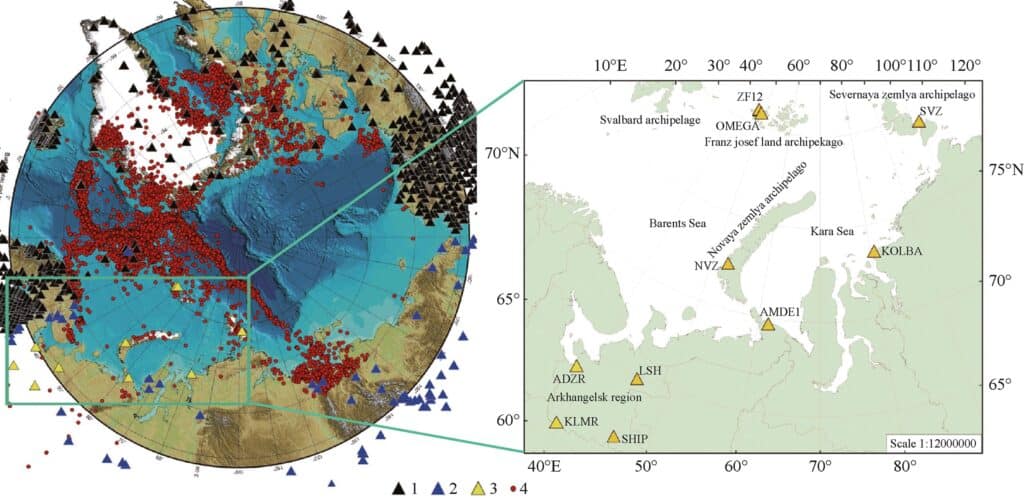
Seismicity for 2015–2021 and location of seismic stations (Map of the Month October 2025)
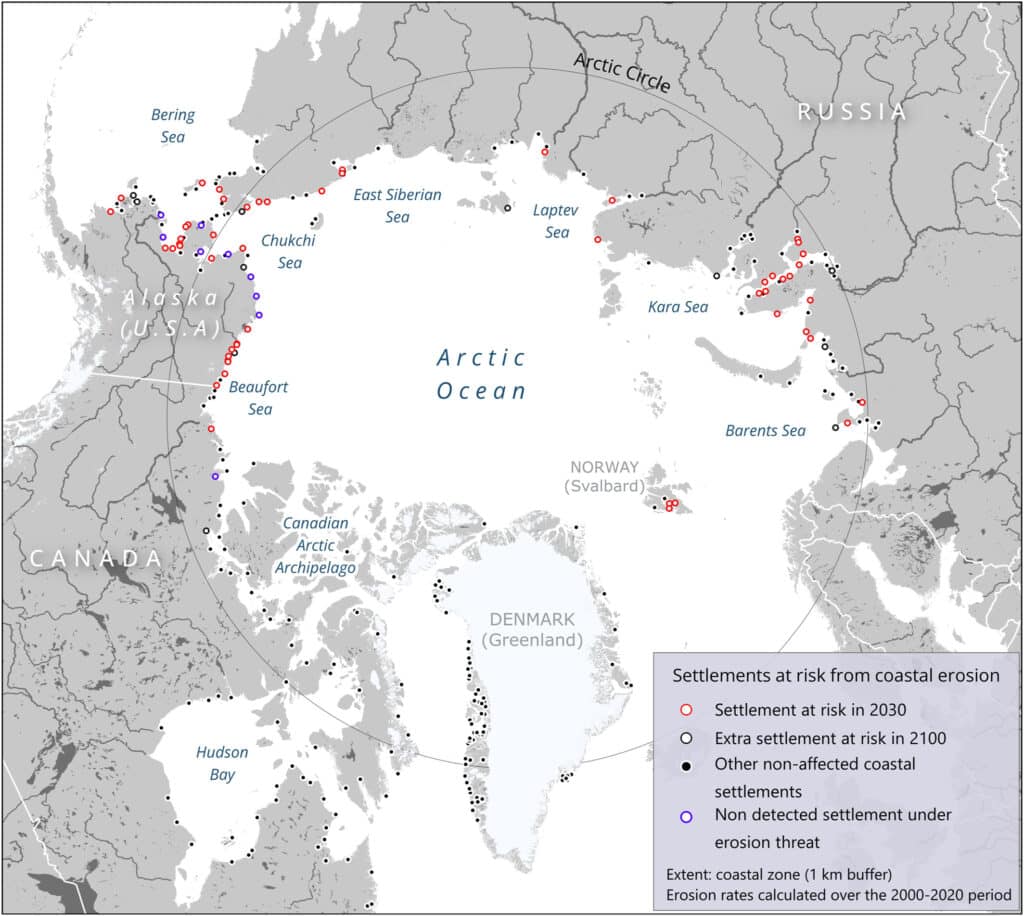
Arctic settlements potentially at risk of coastal erosion, 2030-2100 (Map of the Month November 2025)
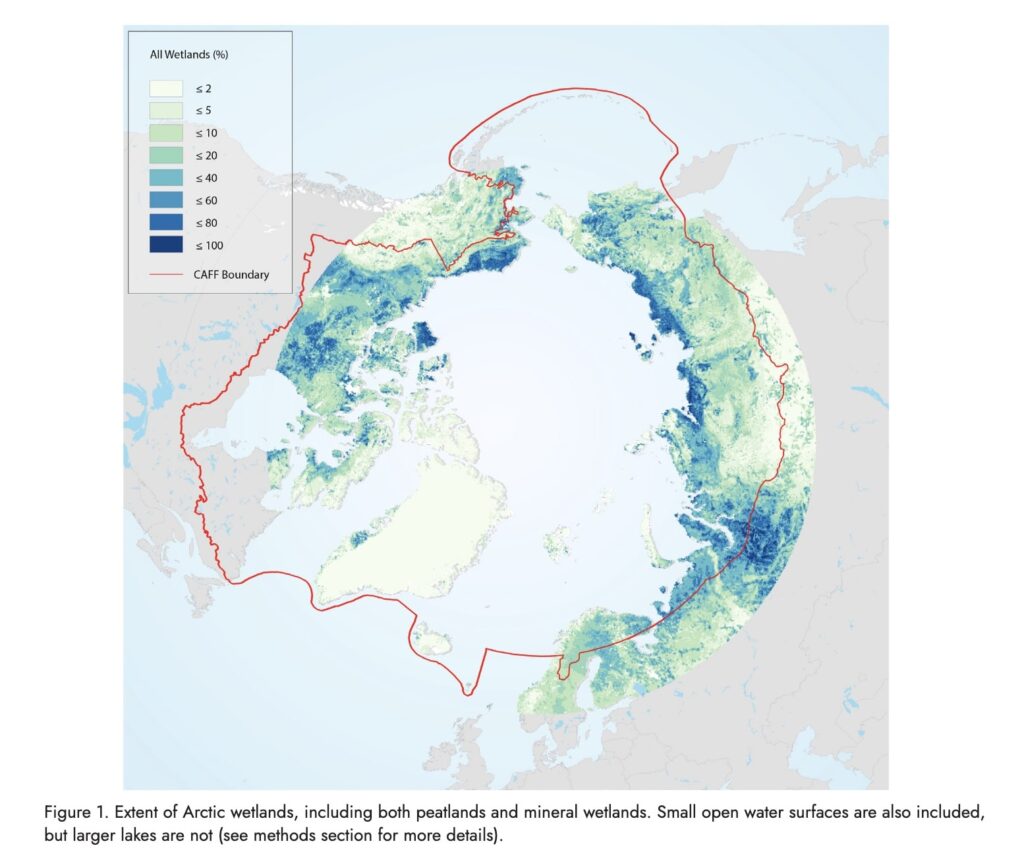
Extent of Arctic wetlands in 2021 (Map of the Month December 2025)