TATW Map of the Months 2026
The Arctic Institute Map of the Month Initiative
Maps provide a useful means of understanding the various ways a region can be understood depending on the industry, discipline, culture or individual. Further, maps allow for the visualization of development and change in a region. Thus, the purpose of our TATW Map of the Month initiative is to highlight the various ways our changing Arctic can be visualised, by showcasing maps created by various geographers, cartographers and organisations around the world. Maps selected for each month reflect a relevant finding or event related to Arctic geography. TATW Map of the Month maps were not be created by The Arctic Institute, but rather shared with permission from the owners in order to make Arctic-related maps more accessible. Check out our 2026 TATW Maps of the Month below.

Shripwrecks of the Arctic (as of 2020) (Map of the Month January 2026)
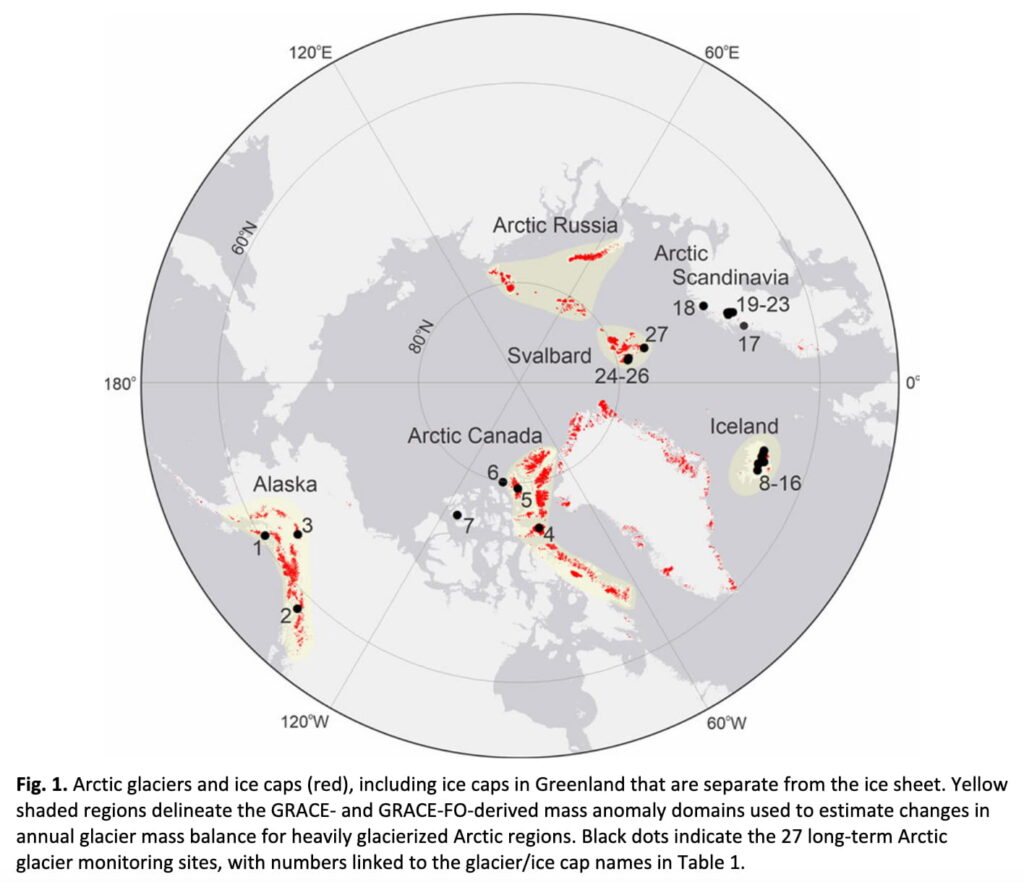
Arctic glaciers and ice caps (as of 2024) (Map of the Month February 2026)
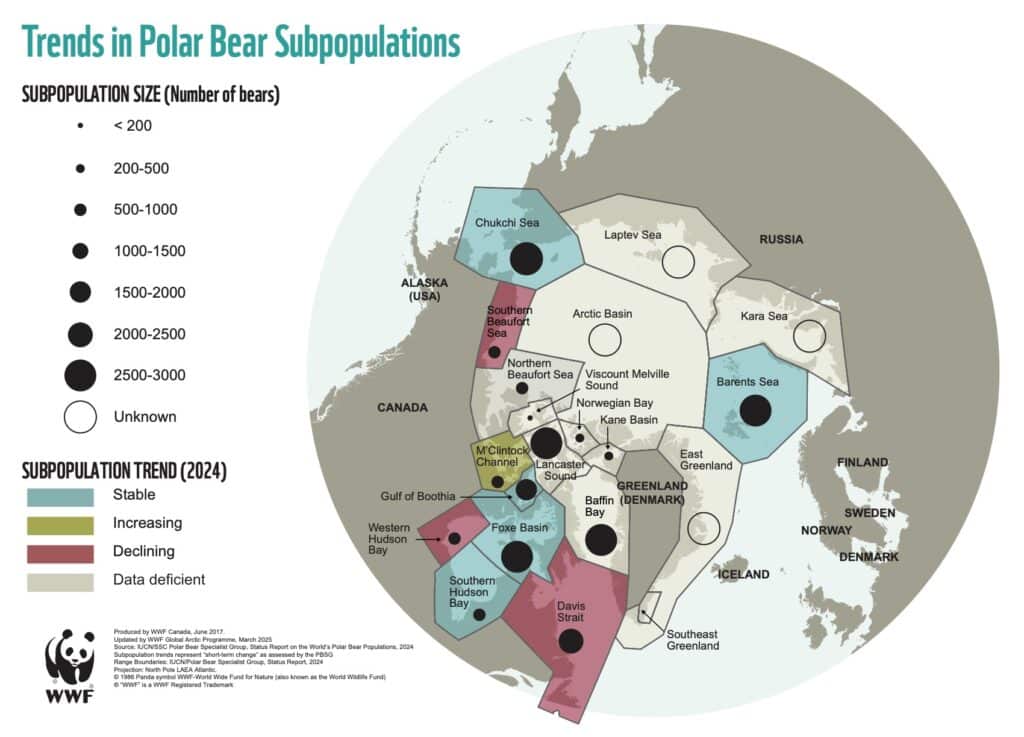
Trends of polar bear subpopulation (as of 2020) (Map of the Month March 2026)