Back to Publications

NASA State of Flux Images of Change: The Impact of Climate Change on the Arctic

By | Multimedia
May 2, 2012

1882 photo taken by G.D. Hazard; 2005 photo taken by Bruce F. Molnia. Courtesy of the Glacier Photograph Collection, National Snow and Ice Data Center/World Data Center for Glaciology

A few weeks ago Moki Kokoris wrote about the importance of “Giving a ‘Visual Voice’ to the Changing Arctic Environment“. Moki described how visual representation is an effective tool to convey “the consequences of climate change to non-scientists” and that “the empirical evidence in the form of images and recorded personal testimonies […] most convincingly builds awareness and enhances the general public’s understanding of the issues.” NASA’s State of Flux gallery does a superior job at visualizing the effects of climate change on our planet. Below you can find a selection of images from NASA’s gallery documenting the dramatic changes occurring in the North American Arctic. Notice: All image captions adopted from NASA’s State of Flux gallery.

Two black and white images showing the melting of the Okpilak glacierGlacier Photograph Collection, National Snow and Ice Data Center/World Data Center for Glaciology

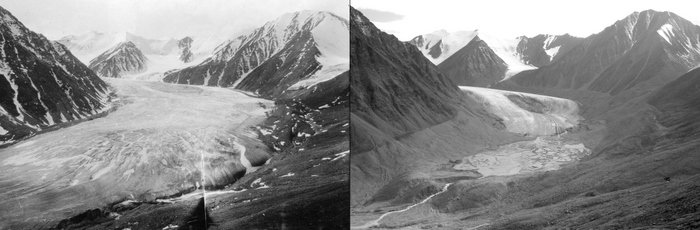
June 1907                                                                      August 5, 2004
Okpilak Glacier, Alaska
1907 photo taken by Ernest Leffingwell; 2004 photo taken by Matt Nolan.

Two images showing the melting of the Carroll glacierGlacier Photograph Collection, National Snow and Ice Data Center/World Data Center for Glaciology
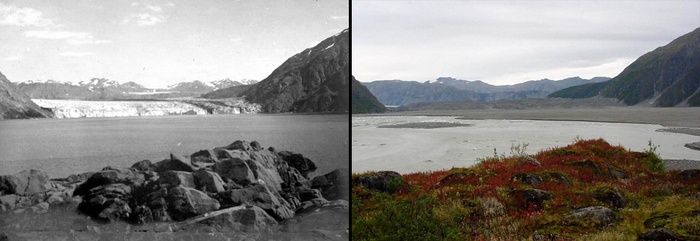
August 1906                                                                    September 7, 2003 
Carroll Glacier, Alaska
1906 photo taken by Charles Will Wright; 2003 photo taken by Bruce F. Molnia.


Two images showing the melting of the Carroll glacierGlacier Photograph Collection, National Snow and Ice Data Center/World Data Center for Glaciology
August 1906                                                                    June 21, 2004
Carroll Glacier, Alaska
1906 image taken by Charles Will Wright. 2004 image taken by Bruce F. Molnia.


Two images showing the melting of the Holgate glacierGlacier Photograph Collection, National Snow and Ice Data Center/World Data Center for Glaciology
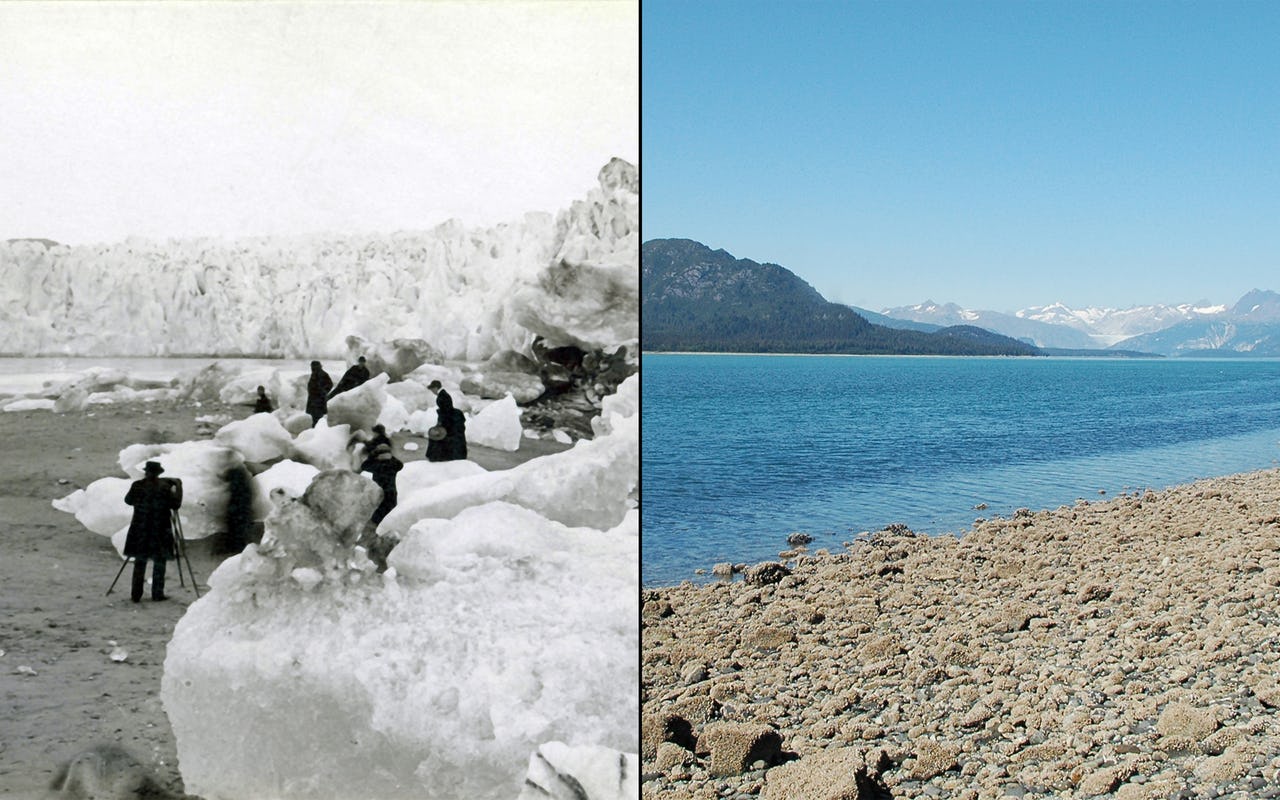
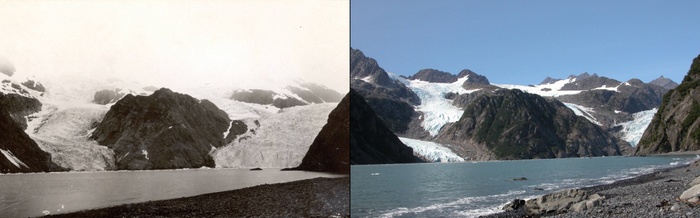
July 24, 1909                                                                  August 13, 2004
Holgate Glacier, Alaska
1909 image taken by Ulysses Sherman Grant. 2004 image taken by Bruce F. Molnia.


Two black and white images showing the melting of the McCall glacierGlacier Photograph Collection, National Snow and Ice Data Center/World Data Center for Glaciology
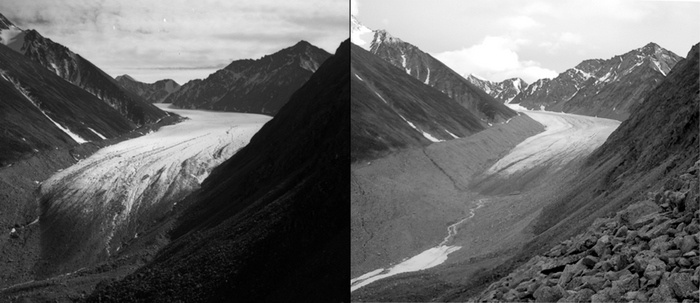
July 1958                                                                       August 14, 2003
McCall Glacier, Alaska
1958 picture taken by Austin Post. 2003 picture taken by Matt Nolan.


Two images showing the melting of the McCarty glacierGlacier Photograph Collection, National Snow and Ice Data Center/World Data Center for Glaciology
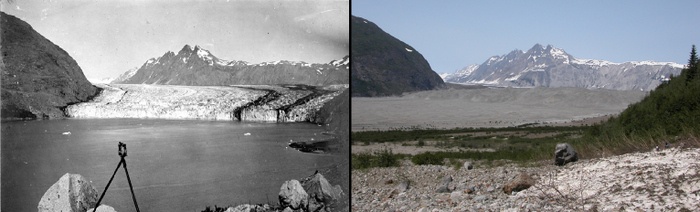
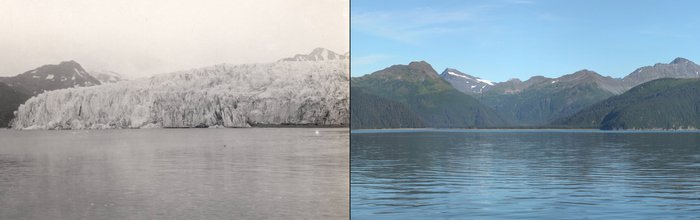
July 30, 1909                                                                  August 11, 2004
McCarty Glacier, Alaska
1909 picture taken by Ulysses Sherman Grant. 2004 picture taken by Bruce F. Molnia.


Glacier melt comparison in AlaskaGlacier Photograph Collection, National Snow and Ice Data Center/World Data Center for Glaciology
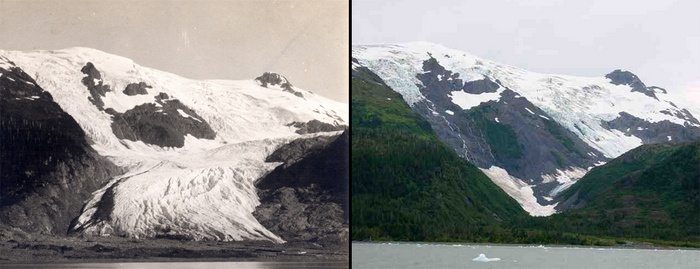
June 29, 1909                                                                 September 4, 2000
Toboggan Glacier, Alaska
1909 picture photographed by Sidney Paige. 2000 picture photographed by Bruce F. Molnia.


Three satellite images of ice melting in GreenlandNASA/GSFC/METI/ERSDAC/JAROS
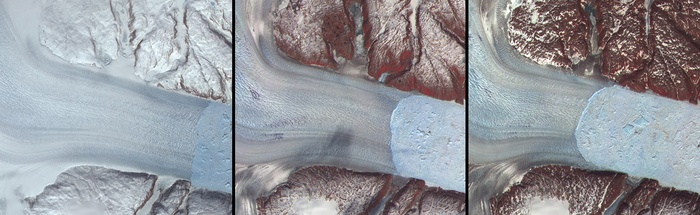
May 12, 2001                                      July 7, 2003.                                     June 19, 2005
Along the margin of the Greenland Ice Sheet, outlet glaciers flow as icy rivers through fjords and out to sea. These pictures show a fjord in which Helheim glacier (on the left) is crumbling into large and small icebergs (light blue, on the right). The glacier outlet (“calving front”) held steady from the 1970s until about 2001, then began to retreat towards its source about 7.5 kilometers (4.7 miles) between 2001 and 2005. The glacier’s flow to the sea has also sped up.
NASA images created by Jesse Allen, NASA Earth Observatory, using data from the Advanced Spaceborne Thermal Emission and Reflection Radiometer (ASTER) on NASA’s Terra satellite.


Two images showing the melting of the Petermann GlacierUSGS Landsat Missions Gallery, U.S. Department of the Interior / U.S. Geological Survey, and NASA Earth portal
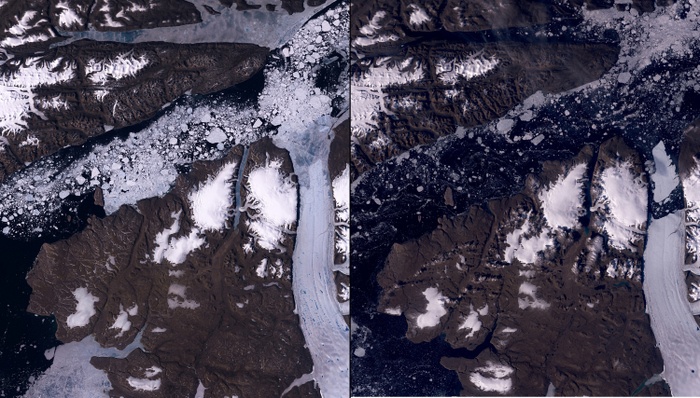
June 26, 2010                                                                  August 13, 2010
Petermann Glacier, Greenland. An iceberg more than four times the size of Manhattan broke off the Petermann Glacier (the curved, nearly vertical stripe stretching up from the bottom right of the images) along the northwestern coast of Greenland. Warmer water below the floating ice and at the sea’s surface were probably responsible for the break.
Images taken by the Enhanced Thematic Mapper Plus sensor aboard Landsat 7.


Three satellite images of ice melting in GreenlandUSGS Landsat Missions Gallery, U.S. Department of the Interior / U.S. Geological Survey
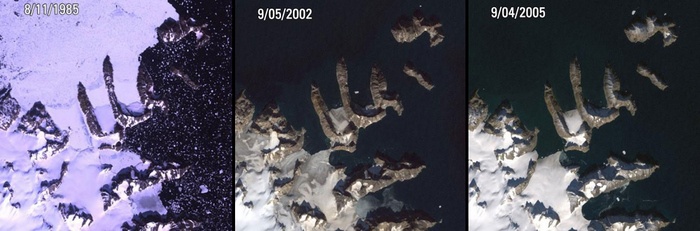
Warming Island, Greenland. On January 16, 2007, the New York Times reported that a new island had been found in Greenland. Warming Island was thought to be an ice-covered peninsula, but it was exposed as an island in 2005, when an ice bridge melted to reveal an open-water strait. More islands like this may be discovered if the Greenland ice sheet continues to disappear. Images taken by the Thematic Mapper sensor aboard Landsat 5 and the Enhanced Thematic Mapper Plus sensor aboard Landsat 7.