TATW Map of the Months 2019
The Arctic Institute Map of the Month Initiative
Maps provide a useful means of understanding the various ways a region can be understood depending on the industry, discipline, culture or individual. Further, maps allow for the visualization of development and change in a region. Thus, the purpose of our TATW Map of the Month initiative is to highlight the various ways our changing Arctic can be visualised, by showcasing maps created by various geographers, cartographers and organisations around the world. Maps selected for each month reflect a relevant finding or event related to Arctic geography. TATW Map of the Month maps were not be created by The Arctic Institute, but rather shared with permission from the owners in order to make Arctic-related maps more accessible. Check out our 2019 TATW Maps of the Month below.
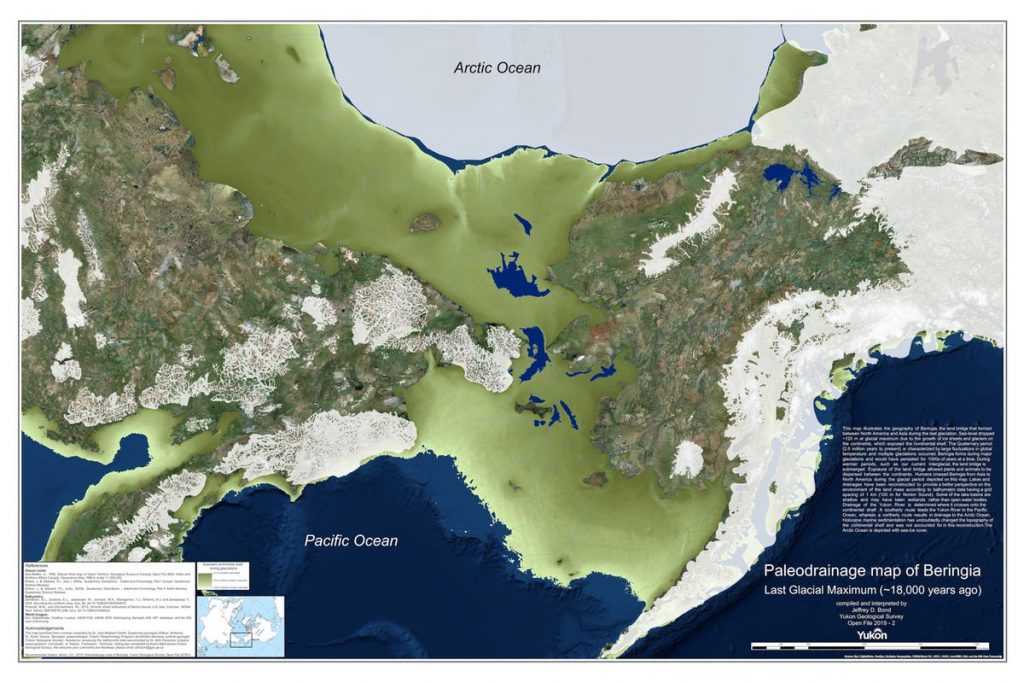
Paleodrainage map of Beringia (Map of the Month March 2019)
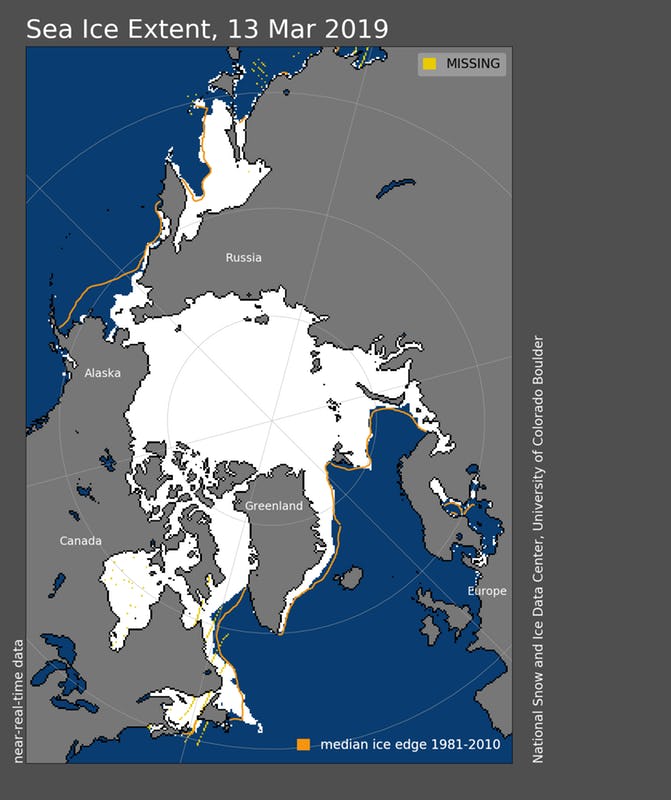
Arctic sea ice extent March 2019 (Map of the Month April 2019)
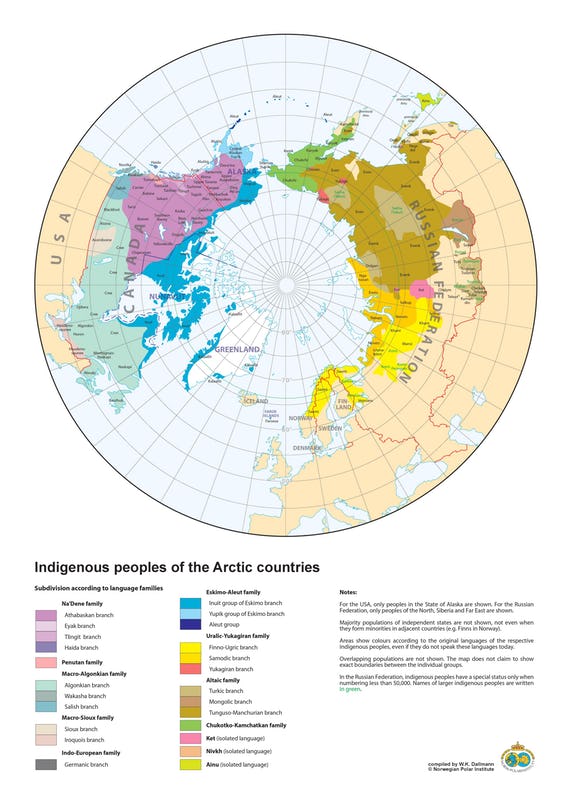
Arctic Indigeneous Peoples (Map of the Month May 2019)
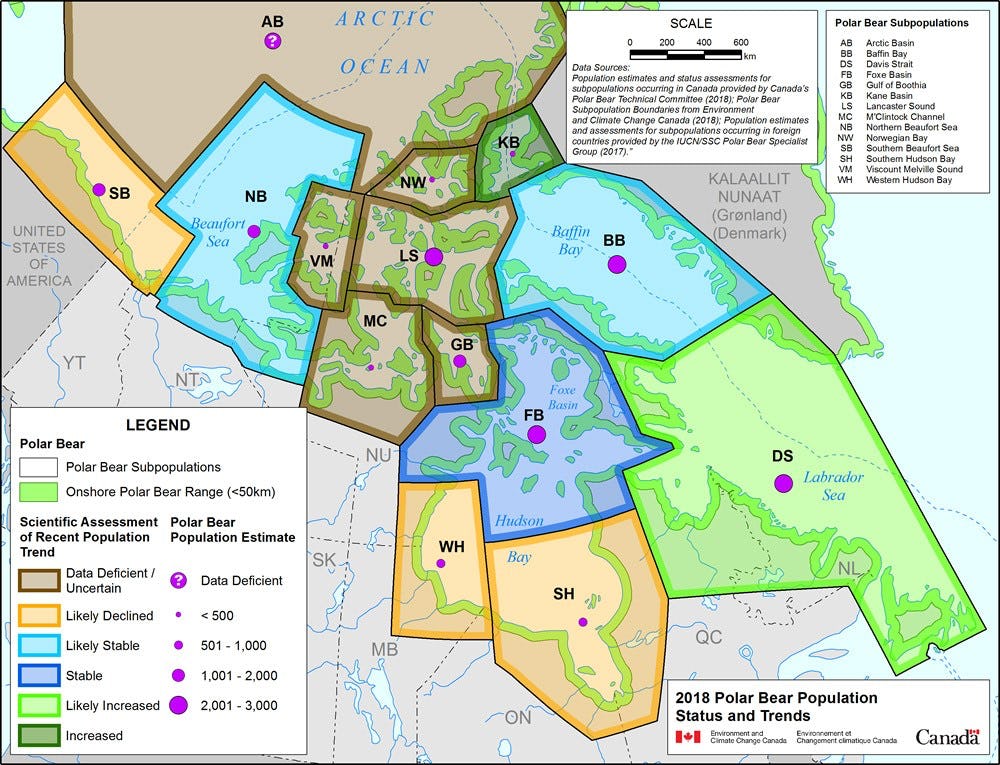
2018 Polar Bear distribution in Canada (Map of the Month June 2019)
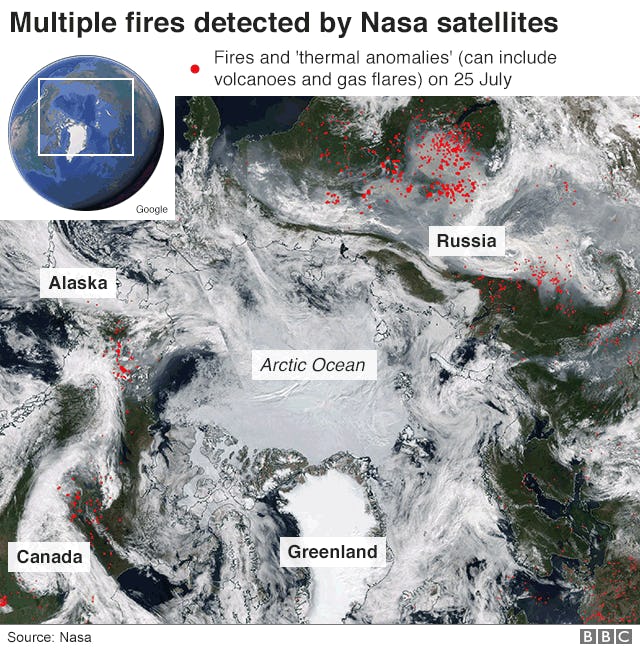
Multiple fires dedected by NASA (Map of the Month July 2019)
High temperatures in Alaska, July 2019 (Map of the Month August 2019)
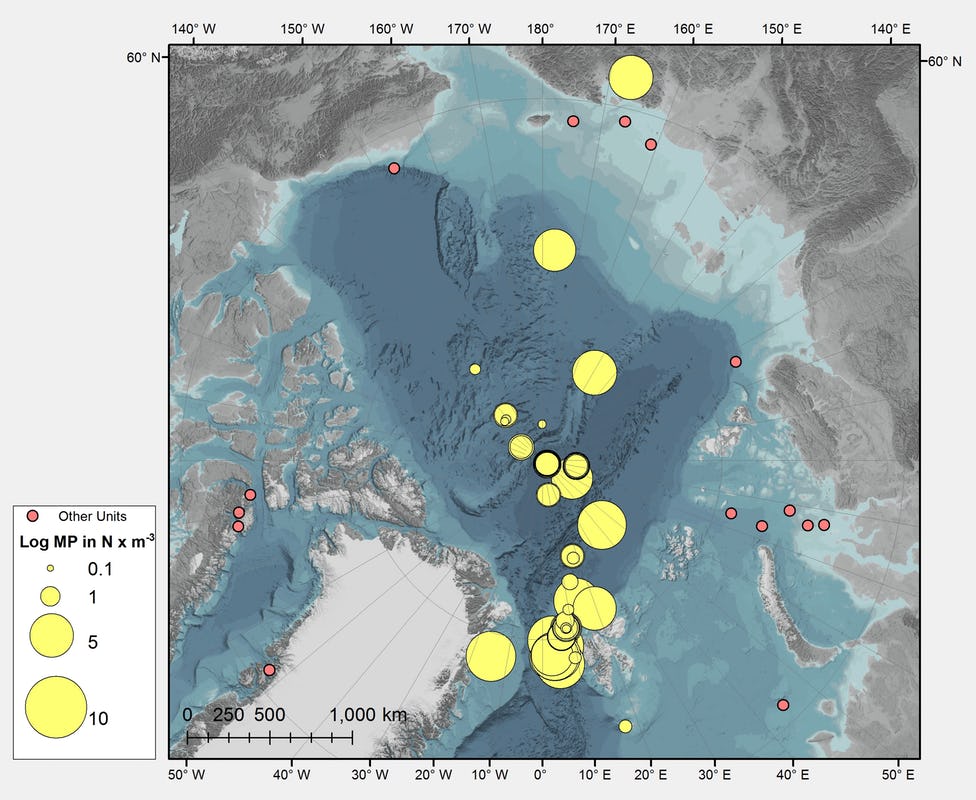
Microplastic concentration in the Arctic, June 2018 (Map of the Month September 2019)
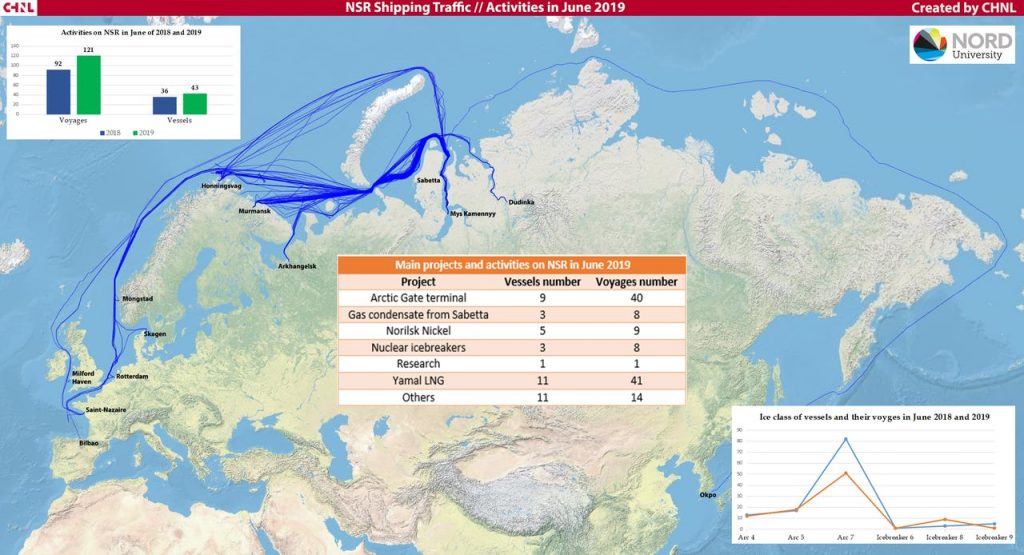
NSR Shipping Traffic – Activities in June 2019 (Map of the Month October 2019)
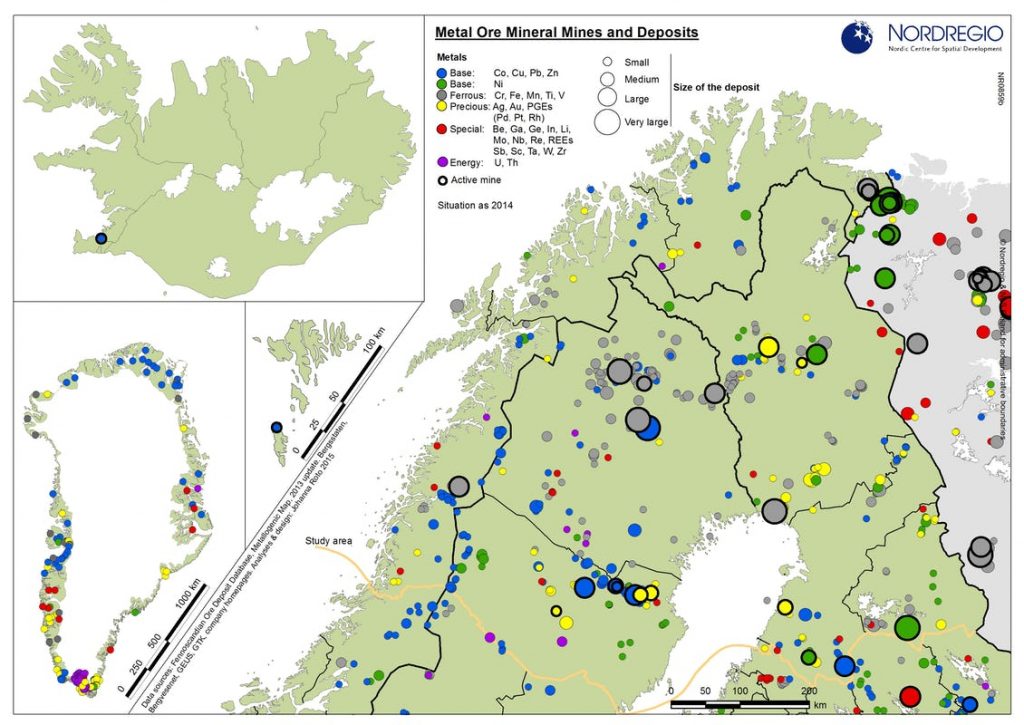
Metal Ore Mineral Mines and Deposits (Map of the Month November 2019)
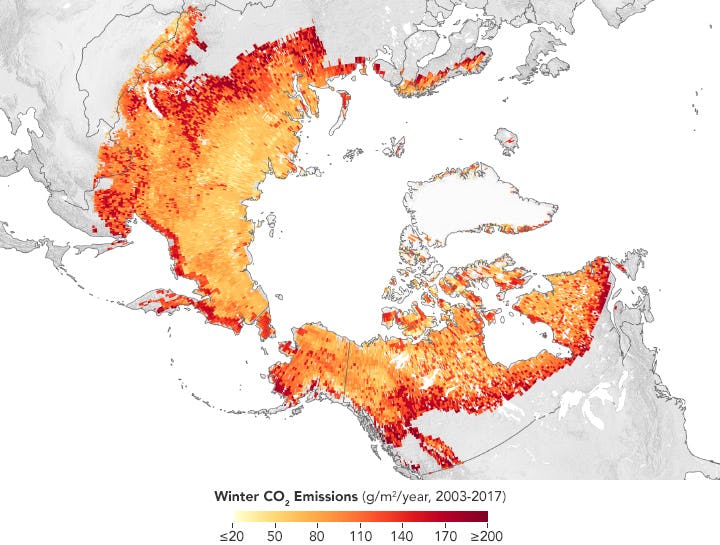
Winter emissions of carbon dioxide (Map of the Month December 2019)