TATW Map of the Months 2020
The Arctic Institute Map of the Month Initiative
Maps provide a useful means of understanding the various ways a region can be understood depending on the industry, discipline, culture or individual. Further, maps allow for the visualization of development and change in a region. Thus, the purpose of our TATW Map of the Month initiative is to highlight the various ways our changing Arctic can be visualised, by showcasing maps created by various geographers, cartographers and organisations around the world. Maps selected for each month reflect a relevant finding or event related to Arctic geography. TATW Map of the Month maps were not be created by The Arctic Institute, but rather shared with permission from the owners in order to make Arctic-related maps more accessible. Check out our 2020 TATW Maps of the Month below.
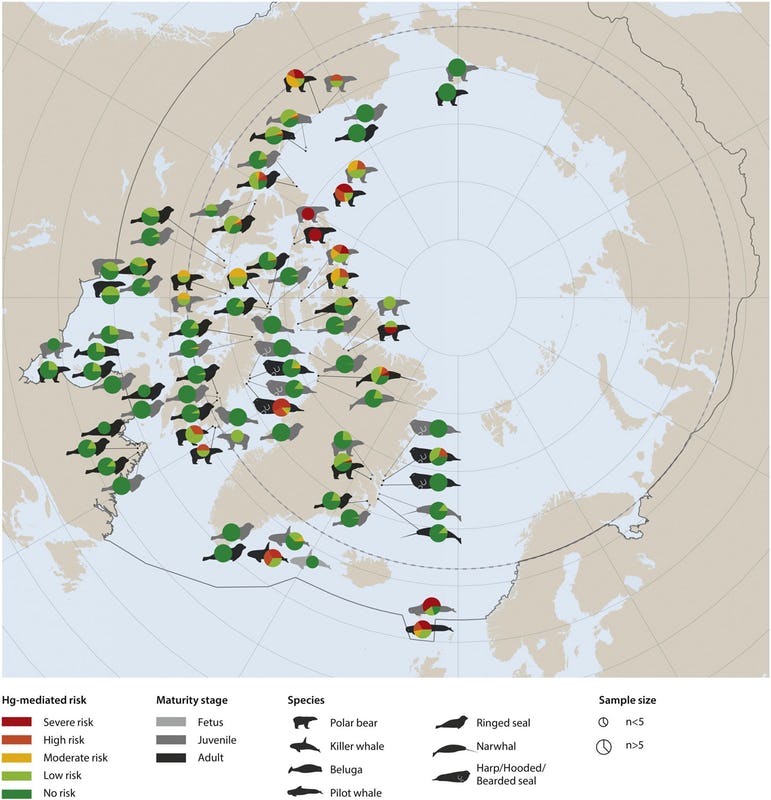
Arctic marine mammal populations (Map of the Month January 2020)
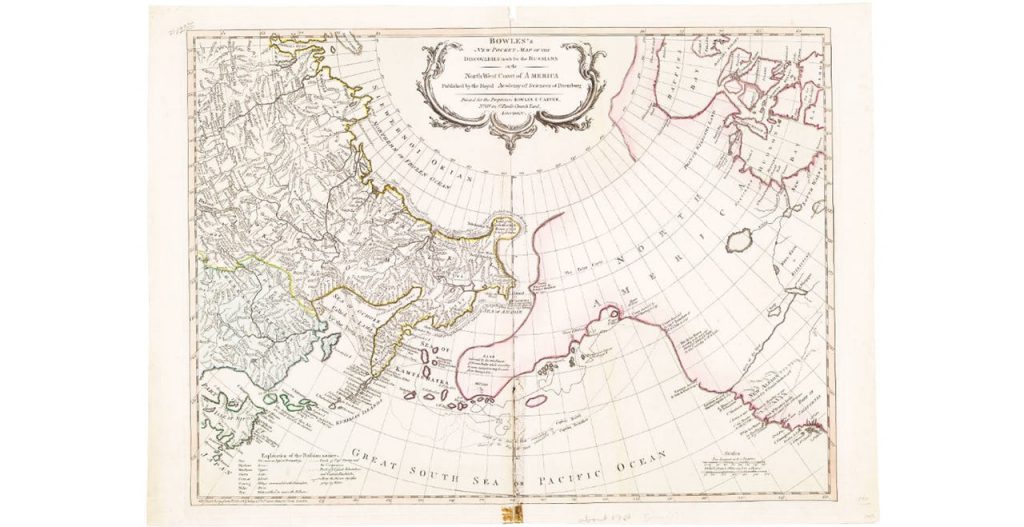
Russian discoveries on the coast of Alaska (Map of the Month February 2020)
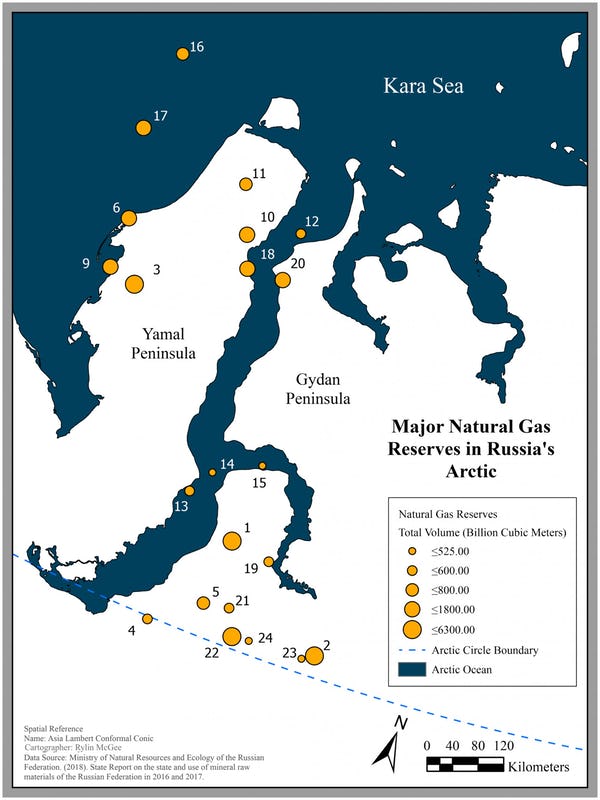
Majora natural gas reserves in Russia’s Arctic (Map of the Month March 2020)
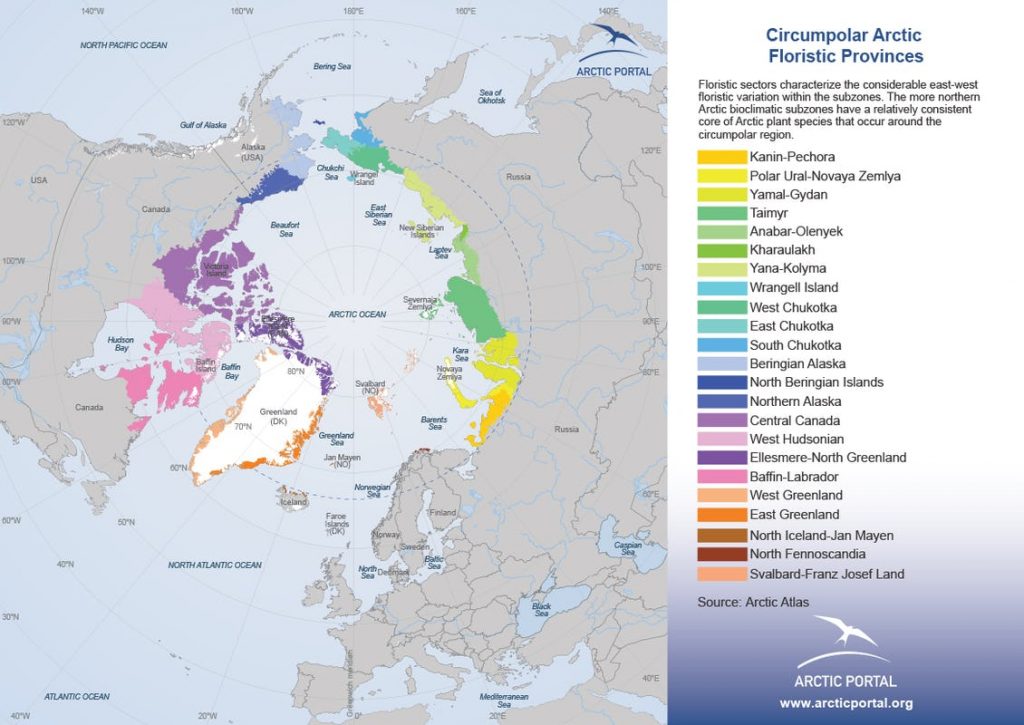
Circumpolar Arctic flouristic provinces (Map of the Month April 2020)
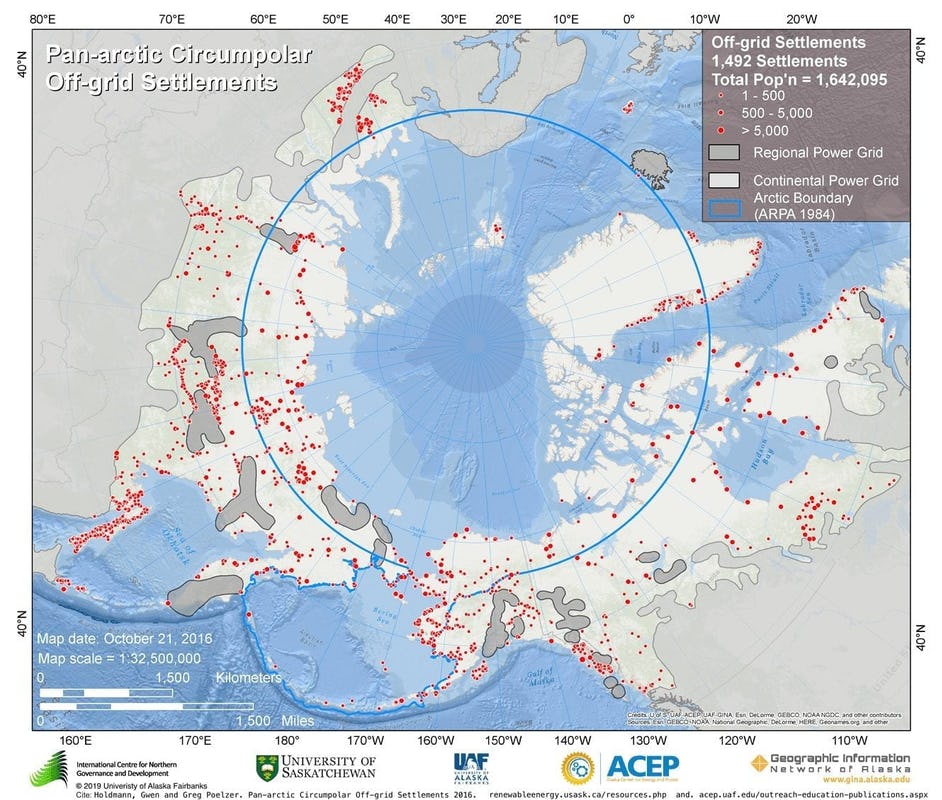
Pan-Arctic Circumpolar off-grid settlements (Map of the Month May 2020)
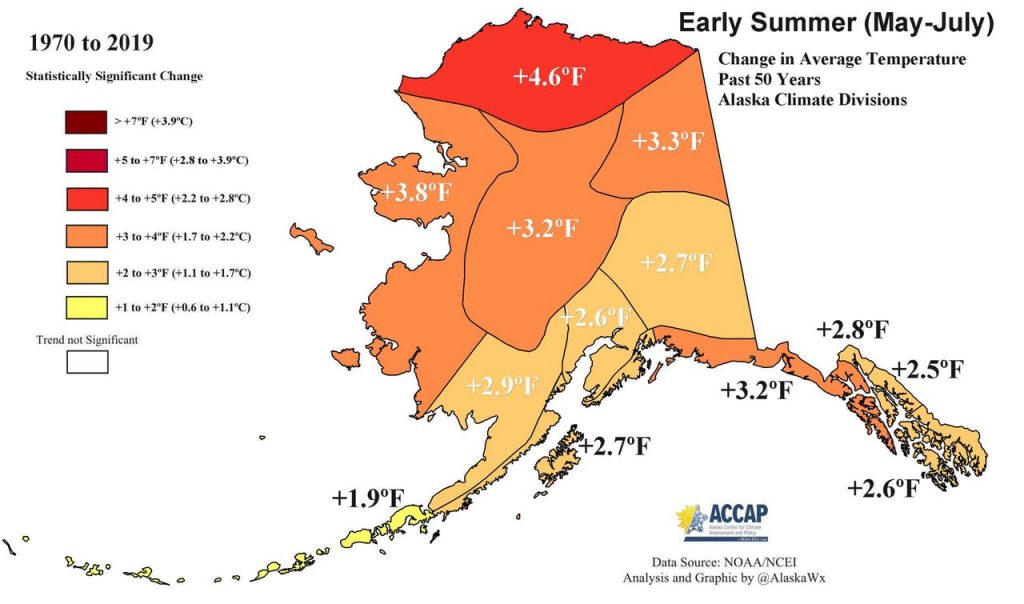
Early summer average temperature change Alaska (Map of the Month June 2020)
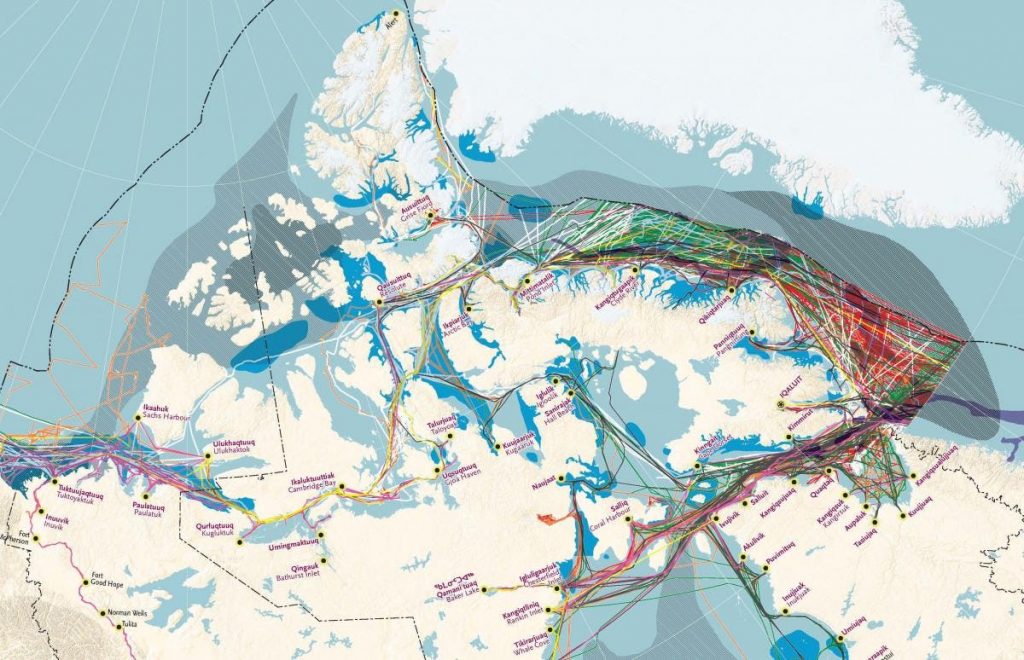
Mapping human impact in the Canadian Arctic (Map of the Month July 2020)
International bathymetric chart of the Arctic Ocean 4.0 (Map of the Month August 2020)
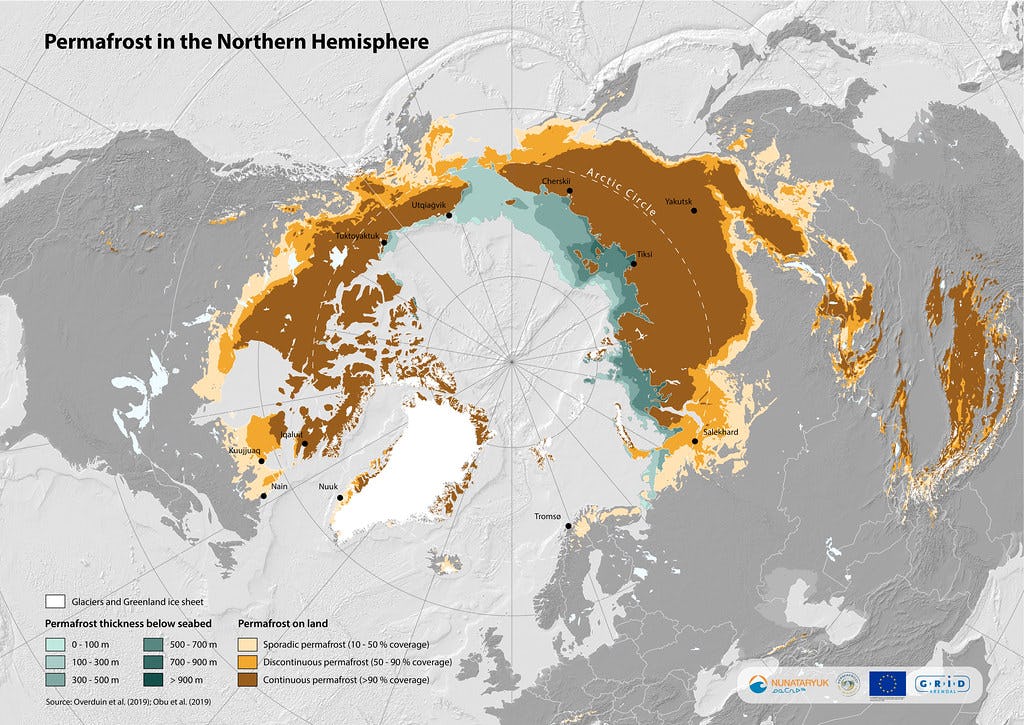
Permafrost in the Northern Hemisphere (Map of the Month September 2020)
Freshwater transport between the Russian Arctic Seas (Map of the Month October 2020)
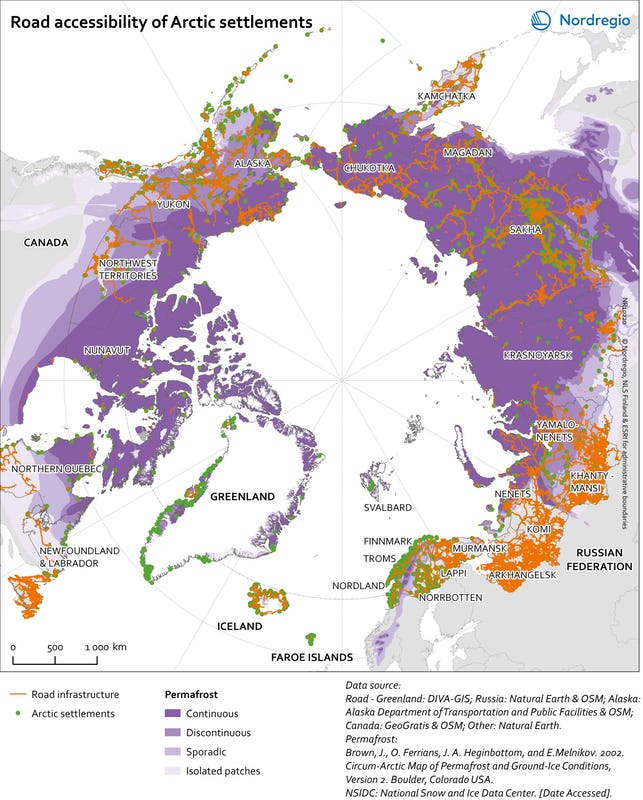
Road accessibility of Arctic settlements (Map of the Month November 2020)
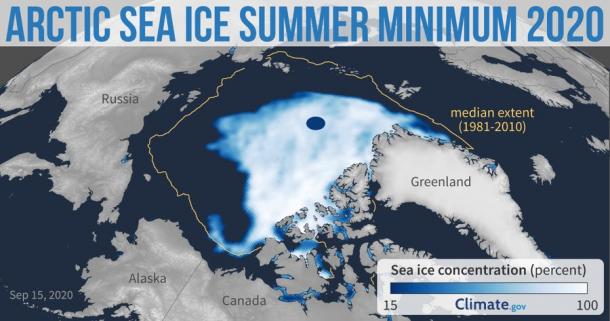
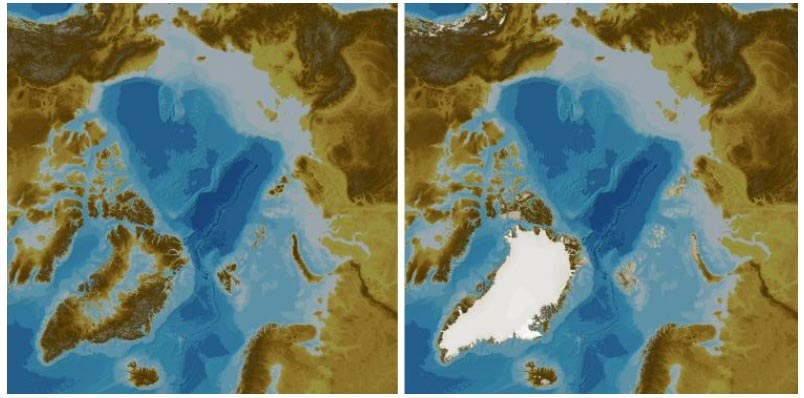
Arctic sea ice minimum 2020 (Map of the Month December 2020)