Keeping an Eye on Iceland: Volcanoes and Climate Change
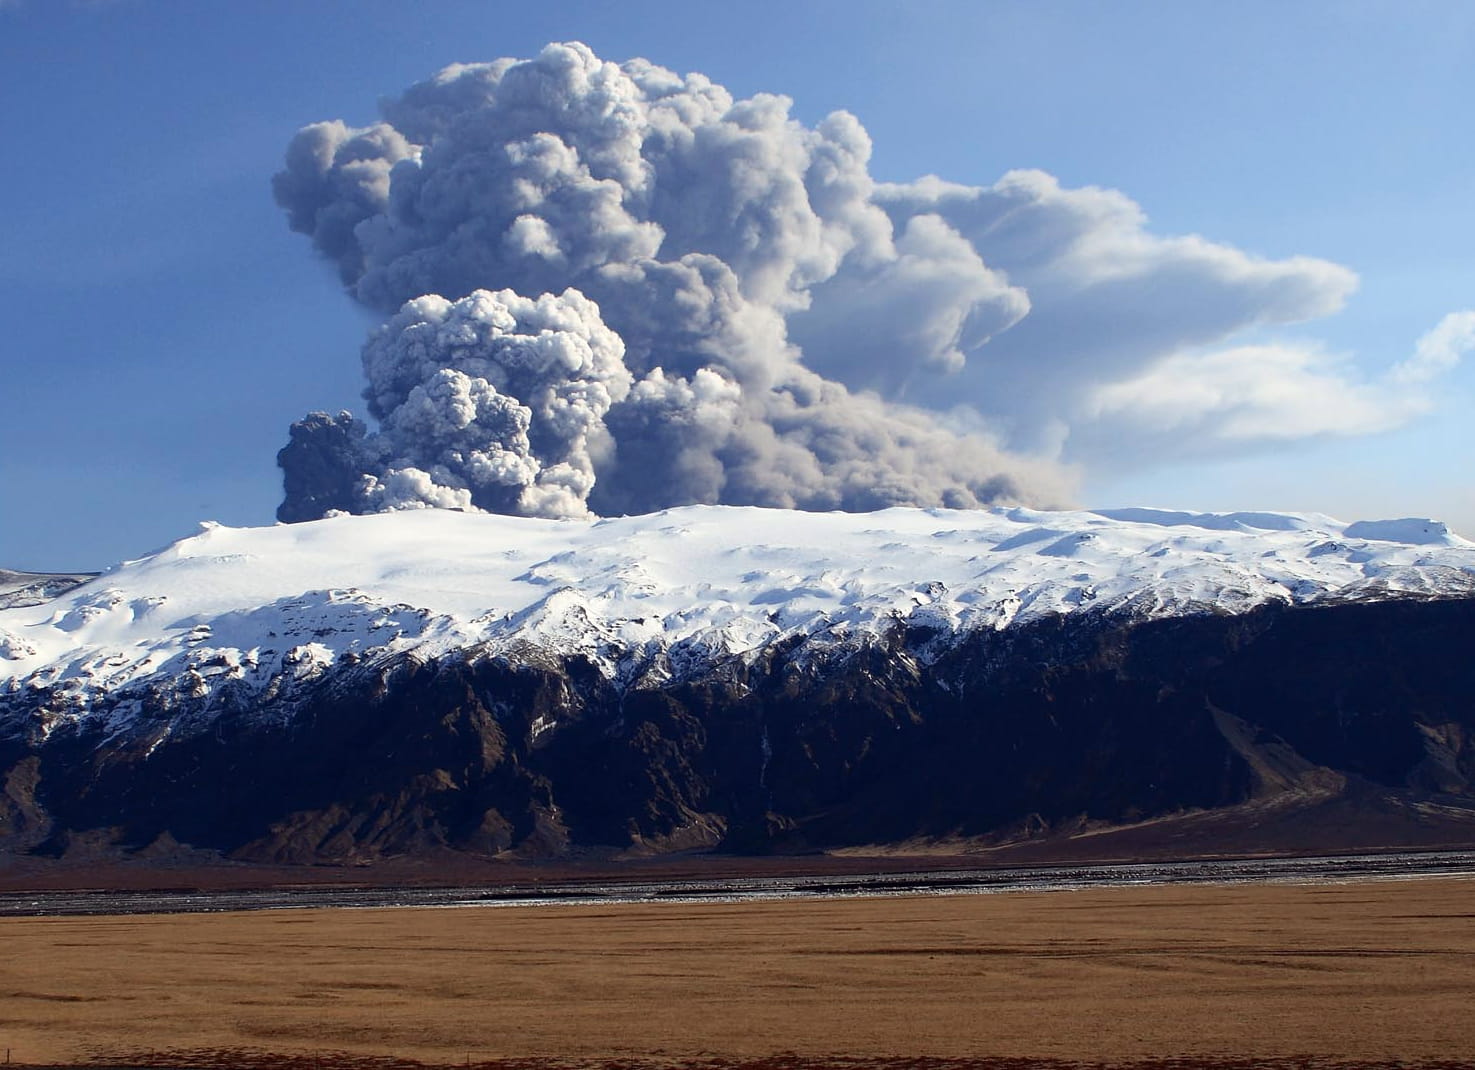
The explosive eruption of Eyjafjallajökull began on 14 April 2010 after interacting with ice and meltwater. The eruption continued for six weeks, and the ash caused significant disruption to air travel. Photo: Árni Sigurðsson
The Arctic Institute Polar Disaster Series 2026
- The Arctic Institute’s 2026 Polar Disaster Risk Reduction and Response Series: An Introduction
- Crisis Management in Arctic Communities: Principles of Crisis Response
- Disaster Risk Reduction and Response: Greenland
- Risk Analysis of Infrastructure Vulnerability and Sustainable Resource Exploitation in the Arctic
- Ships in the Arctic Need to Plan to Survive Until Help Arrives
- From Pandemic to Permafrost: Legal Pathways for One Health Preparedness in Arctic Communities
- Icebergs and Navigation Safety in Antarctica: Possible Impact of new Sea-Ice Regime in the Southern Ocean and South Atlantic Ocean
- Legal Preparedness for One Health in Polar Regions: Strengthening Disease Surveillance
- A Framework for Avoiding Polar Disasters
- Keeping an Eye on Iceland: Volcanoes and Climate Change
- Choosing the Bear: Navigating Spectacular Risks in Longyearbyen
- Local Perspectives in Disaster Risk Reduction: Visualising Disaster Risk in Svalbard
- The Arctic Institute’s 2026 Polar Disaster Risk Reduction and Response Series: A Conclusion
Iceland used to be 100% covered by ice, about 25,000 years ago during the Last Glacial Maximum (LGM), which is the most recent period in Earth’s history when glaciers and ice sheets were at their greatest extent.1) This time period was roughly 26,000 to 19,000 years ago.2) At present, only 10% of Iceland’s land mass is covered by glaciers.3)
The United Nations Intergovernmental Panel on Climate Change (IPCC) chronicles how global temperature changes over long timescales. Their most recent climate change assessment report shows that the Earth’s global temperature has increased 1.1°C since humanity’s main industrial period began due to industrialization from humans by emitting greenhouse gases like carbon dioxide, land-use change, and unsustainable use of energy.4) An increase of 1.1°C may not seem like a drastic change, but it can be the difference between water freezing (0°C) or melting (1.1°C). Therefore, the Arctic is one of the regions most affected by increased warming since snow, ice, and glaciers start to melt.
In fact, the Arctic is warming nearly four times as fast as the rest of the world.5) This phenomenon is known as Arctic Amplification, which can be calculated across different regions of the Arctic from weather stations around the globe. In particular, the Arctic Amplification for Iceland shows that warming is twice as fast as the rest of the world, compared to other Arctic regions like northern Siberia that are warming as much as seven times as fast. While the warming climate in Iceland may not be as fast as Siberia, it is still too high to keep polar ice sheets frozen.6)
When ice sheets melt rapidly, hazards can result in loss of infrastructure, livestock, and life. Specifically in Iceland, this includes at least two hazards influenced by climate change: jökulhlaups (glacial outburst floods) and even volcanic eruptions. Volcanic eruptions and climate change may sound like an odd connection at first, but it is very relevant in Iceland. Of the 41 active volcanic systems in Iceland, 12 of them are under Icelandic glaciers.7) In addition, the most active volcano in Iceland, Grímsvötn, and Iceland’s largest volcanic system, Bárðarbunga, are both under ice. As the glaciers continue to melt due to increasing warming, volcanic pressure that has built up underneath is no longer constrained by the weight of the glacier, creating new pathways for magma migration. Thus, it is important to study how these unique volcanic systems have evolved through time.
Review of Rock Types: Glacio-Volcanic Settings
In order to understand the connection between volcanoes and climate in Iceland, there needs to be a review of Iceland’s geology. Iceland’s geology consists of ~75% basaltic lava flows,8) which is a type of lava rock that erupts and crystallizes on the Earth’s surface and contains elements enriched in Magnesium (Mg), Iron (Fe), and Calcium (Ca), but is comparatively low in Silicon (Si). Andesitic lava has more elements enriched in Potassium (K) and Sodium (Na) and higher in Si, with rhyolitic lavas containing the highest amounts of Si (up to 75% compared to 48%–52% for basaltic lavas), K, and Na.
But what basalt lacks in Si it makes up for in heat. Basalts are notoriously higher in temperature (1,100°C) than rhyolitic lavas (800°C). Combined with its lack of Si and high temperature, it can flow like rivers in a stream, rather than the typical ash eruption seen from volcanoes like Vesuvius in Italy. However, basaltic lava generates new rock types when erupted into ice, snow, or meltwater. These interactions were common in Iceland when it was completely covered by ice; volcanic eruptions did not stop when glaciers covered the whole country. As a result, the two main rock types that form from glacio-volcanic interactions are hyaloclastite and pillow basalts (Fig. 1).
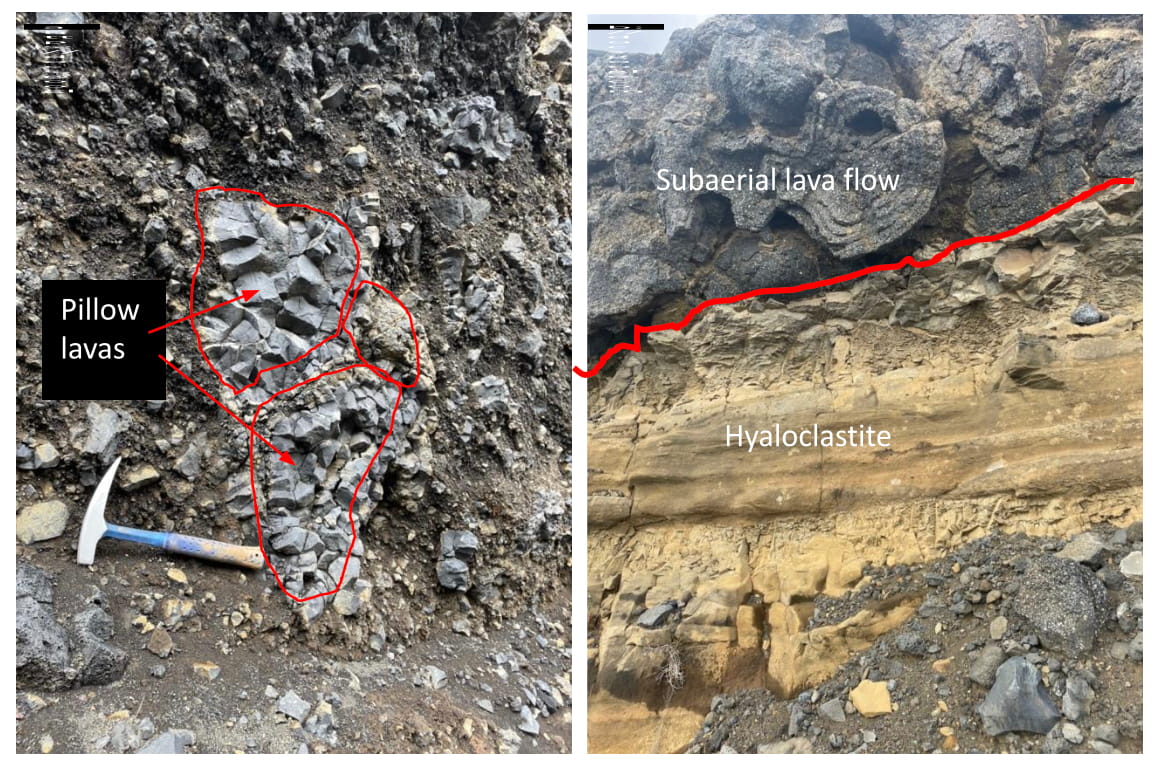
Pillow basalts are basaltic lava that has formed under thick ice/meltwater and high pressures, while hyaloclastite forms when basaltic lava erupts under thin ice/meltwater and lower pressures. These two rocks both contain basaltic glass. Basaltic glass, more technically known as sideromelane/tachylyte, forms from the rapid cooling of lava with ice or meltwater. Given that Iceland has been totally covered by ice sheets in the past, pillow basalts and hyaloclastites with their glassy eruptive products are more common in Iceland than any other place on Earth.
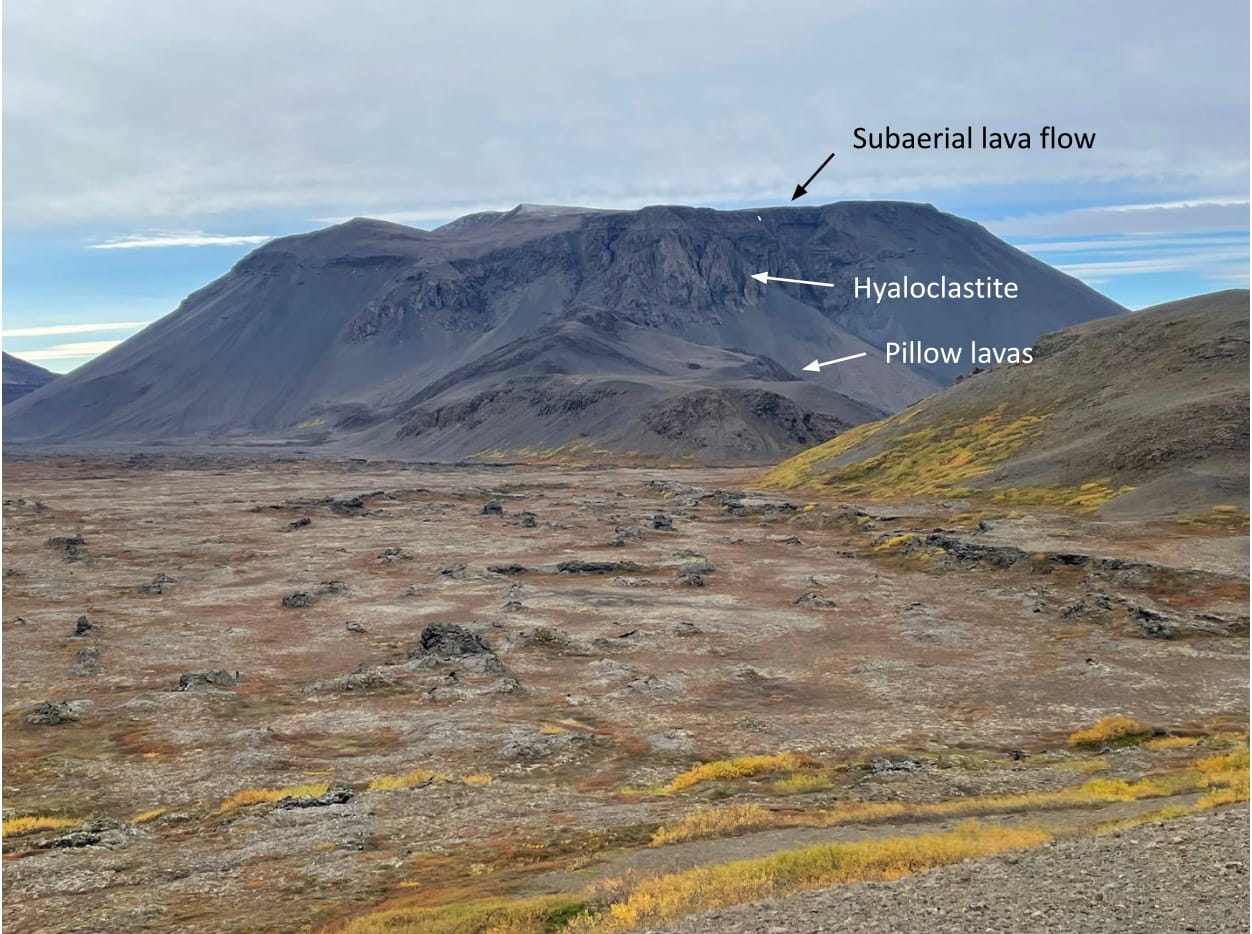
Large and continual eruptions preserved glacio-volcanic landforms known as tuyas (Fig. 2). Tuyas are flat-topped, steep-sided volcanoes when magma erupts into confining ice, and they are scattered throughout Iceland along its active volcanic rift zones. A typical construction of a tuya is pillow basalts at the base, and as the magma continues to melt through the ice, it starts to form hyaloclastites. Finally, if the eruption lasts long enough and contains a sufficient supply of magma, it will melt through the ice and create a capping basaltic lava flow. As a result, geochemists can analyze the changes in volatiles (molecules that prefer to be in the gas phase) from the different glacio-volcanic rocks during an eruption into ice.
Methods Used to Obtain the Geochemistry of Volcanic Glass
The chemical composition of volcanic glass can help geochemists understand its eruptive journey. Volcanic glasses have different water (H2O) concentrations depending on whether they are generated under thick ice, thin ice, or meltwater. One of the main scientific instruments to measure water content in volcanic glass is a Fourier Transform Infrared (FTIR) Spectrometer.9) A FTIR spectrometer shoots a beam of infrared light through the volcanic glass. Infrared light cannot be seen with human eyes because the wavelength of light is longer than the visible light spectrum. Infrared light occurs between 780 nanometers to 1,000,000 nanometers (1 millimeter). For reference, visible light only occurs from 380 to 700 nanometers. To put this small scale into perspective, a single human hair is around 60,000 to 100,000 nanometers thick. The wider spectrum in the infrared provides geochemists with the ability to detect important volatiles like water content in volcanic glass.
When the infrared light passes through the volcanic glass, the FTIR records the wavelength which is around 2.8 micrometers (2,800 nanometers) for water. It also records the absorbance, which is how much light energy is absorbed by the water molecules in the sample. Once this data is collected, we can use equations such as the Beer-Lambert Law to calculate how much water in a weight percentage was in the volcanic glass. This water content can then be used for further models such as calculating ice thickness.
Introducing Ice Thickness Estimates Using Geochemistry
Calculating ice thickness on glacio-volcanoes is important because any change in the glacier’s volume potentially affects magma in the Earth’s interior. For example, after the LGM, glacial melting led to a six-fold increase in erupted volumes in Iceland based on geochemical analysis10) and computer models.11) This research shows how volcanoes erupted in the past, helping us prepare for future eruptions under ice. Therefore, constraining how thick the ice was in the past on volcanoes will help monitoring efforts for current active volcanoes under the ice in Iceland as the climate continues to warm.
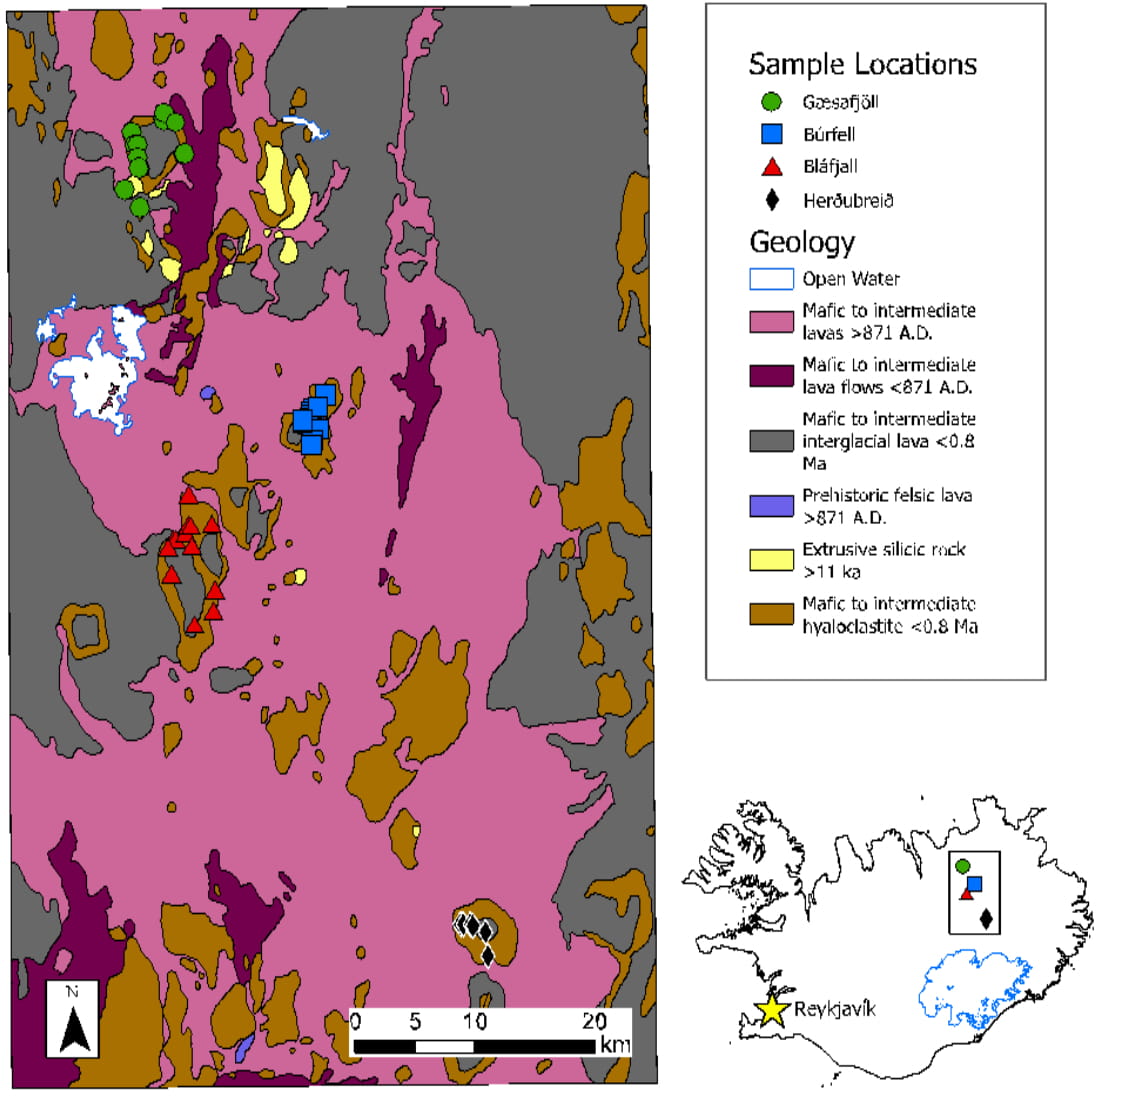
My master’s research focused on volcanoes in northeast Iceland located along Iceland’s active northern volcanic zone. This is an ideal location to study ice thickness estimates, because there are multiple tuyas present. These tuyas have been used as a yardstick for ice thickness estimates in the past,12) but few have conducted a geochemistry study using volcanic glass to calculate ice thickness. As a result, we sampled four famous tuyas in northeast Iceland: Gæsafjöll, Búrfell, Bláfjall, and Herðubreið for geochemical analysis (Fig. 3). Previous studies show that ice thickness increased towards the south to the present day Vatnajökull ice cap, which is Iceland’s largest glacier. This makes sense, because Vatnajökull has not melted completely while the rest of northeast Iceland is ice-free now.
In order to calculate ice thickness, the volcanic glass needs to be doubly polished into glass wafers and analyzed by a FTIR. The FTIR provides the water content contained in the volcanic glass. The next step is to input water content into the model VolatileCalc.13) This model compiled water saturation pressures, which is when water vapor is in equilibrium with the magma, of volcanic glass that formed at different temperatures and compositions. Ultimately, we would expect to see volcanic glass erupting at lower pressures in meltwater or thin ice because it has less overburden, versus volcanic glass erupting under higher pressures for thick ice. Our results show something we did not expect, which was varying ice thickness for each of the tuyas, not increasing gradually to the south towards Vatnajökull as previously hypothesized.
However, our calculations have some limitations. Not only can an FTIR measure water, but it can also measure carbon dioxide (CO2). For our analyses, there was a lack of carbon dioxide wavelengths which means the concentrations were below the detection limit. Thus, it is important to interpret the water data with caution to avoid assumptions about how thick the ice was in the past. The difference between 100 m and 700 m of ice could impact the way an eruption behaves under glaciers in the future, and accurate CO2 measurements are needed to create a reliable estimate.
Implementation for Policy and Evidence-Based Action Involving Volcanic Risks
New ice thickness estimates are a valuable dataset for policymakers and evidence-based action. For example, Háskóli Íslands (University of Iceland) has started a new initiative on the effects of climate change-induced ice retreat on seismic and volcanic activity.14) The goal of the project is to study how rapid glacier fluctuations due to climate change impact the occurrence of other hazards like earthquakes and volcanoes in Iceland. The project plans to create an integrated database that catalogues volume changes in Iceland’s glaciers using computer models.
One of the benefits of computer models is that they can forecast climate warming scenarios in the future, and current models suggest that Iceland’s glaciers will be gone in 150–200 years,15) a geologic blink of the eye. ISVOLC aims to model how glacial retreat changes magma for four active volcanoes in Iceland, one of them being Askja, which is located in northeast Iceland. The ice thickness data from northeast Iceland will therefore aid in predicting accurate scenarios of how glaciers change in the future by utilizing field data. Computer models and field data rely on each other for a mutualistic relationship to understand how the glacial and volcanic processes have operated in the past (field data) to then predict how they might change in the future (computer models). Once these synergistic studies between computer models and field data are completed, it is crucial to communicate to policy makers to advocate for action to reduce the multiple hazards associated with warming in Iceland.
Iceland’s Ministry for Foreign Affairs, in its most recent report on matters concerning the Arctic Region,16) outlines and lists 19 focus points for future sustainability in the Arctic. Some of these focus points were solidified during the Arctic Council’s Ministerial Meeting in 2021 in Reykjavík that demonstrates Iceland’s commitment to sustainable development.17) The main ones to address climate change are:
- Put sustainable development first, based on the United Nations Sustainable Development Goals.
- Focus on countering climate change and responding to its negative effects in the Arctic region.
- Put environmental protection first, including the protection of the biota and biodiversity of the Arctic region.
- Safeguard the marine environment, including taking actions to prevent ocean acidification and pollution.
- Reduce fossil fuels in the Arctic region, including ending the use of heavy fuel oil in shipping, and improving access to renewable energy sources.
- Support international scientific cooperation in the Arctic region that includes forming an Arctic research program.
One of the most useful monitoring systems for how volcanoes and glaciers change in short time periods are Global Positioning Systems (GPS). For example, a collaborative effort in Iceland called the Glacier Web Portal utilized methods using satellites and GPS measurements that show how glaciers have been decreasing in volume.18) In addition, GPS can be used to monitor ground deformation—a process where the Earth’s surface changes in shape, elevation, or position—before eruptions in Iceland. Many volcanoes inflate and deflate like a ballon as magma pressures fluctuate, so GPS stations can alert scientists when an eruption might occur in order to prepare the general public accordingly.
Looking into the past of volcanic and glacial history using new geochemical methods, forecasting using computer models for future hazard implications, and implementing instruments that record real-time measurements of the current conditions of Iceland’s glaciers and volcanoes, all help to monitor climate change and volcanism. Continuing to fund new scientific research and increasing the job market that helps the environment such as renewable energy, conservation, and geology contributes to Iceland implementing its focus points for the next decade of climate sustainability in the Arctic.
Cameron Essex is currently a Fulbright-National Science Foundation Arctic Research Fellow with Fulbright Iceland, and received their master’s in Geoscience from the University of Wisconsin-Milwaukee. Dr. Barry Cameron is an Associate Professor of Geoscience at the University of Wisconsin-Milwaukee.
References