TATW Map of the Months 2021
The Arctic Institute Map of the Month Initiative
Maps provide a useful means of understanding the various ways a region can be understood depending on the industry, discipline, culture or individual. Further, maps allow for the visualization of development and change in a region. Thus, the purpose of our TATW Map of the Month initiative is to highlight the various ways our changing Arctic can be visualised, by showcasing maps created by various geographers, cartographers and organisations around the world. Maps selected for each month reflect a relevant finding or event related to Arctic geography. TATW Map of the Month maps were not be created by The Arctic Institute, but rather shared with permission from the owners in order to make Arctic-related maps more accessible. Check out our 2021 TATW Maps of the Month below.
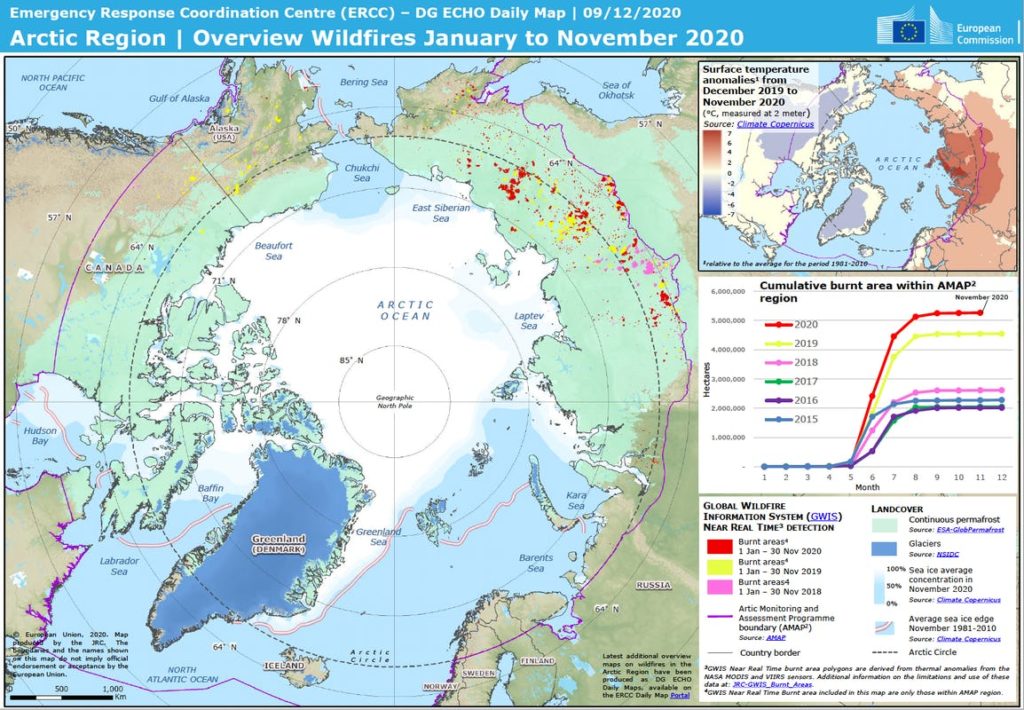
Overview Arctic wildfires Jan-Nov 2020 (Map of the Month January 2021)
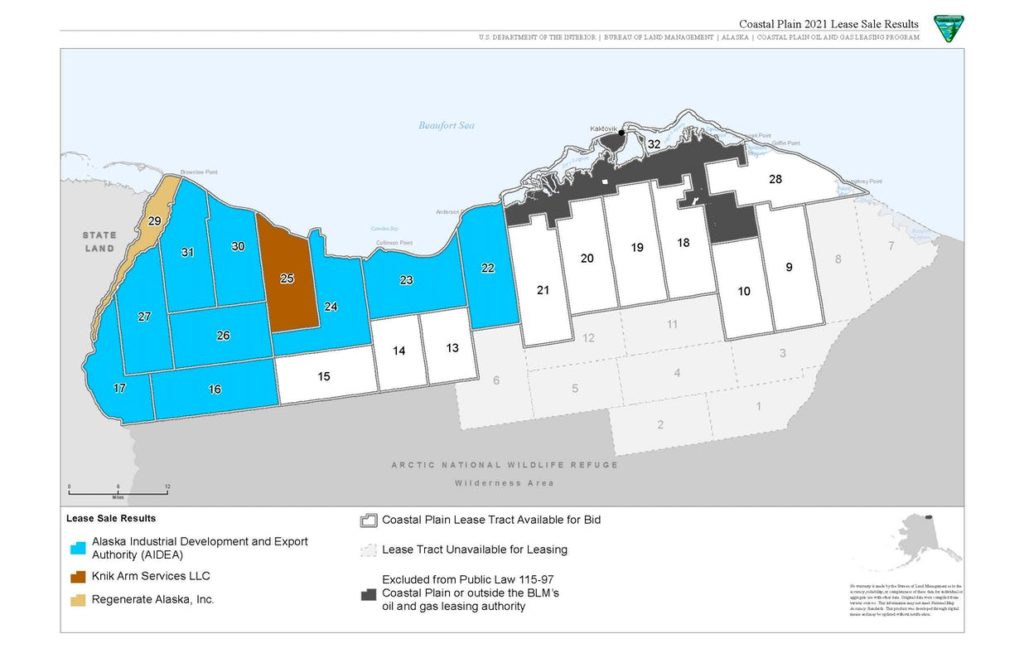
ANRW coastal plain lease sale January 2021 (Map of the Month February 2021)
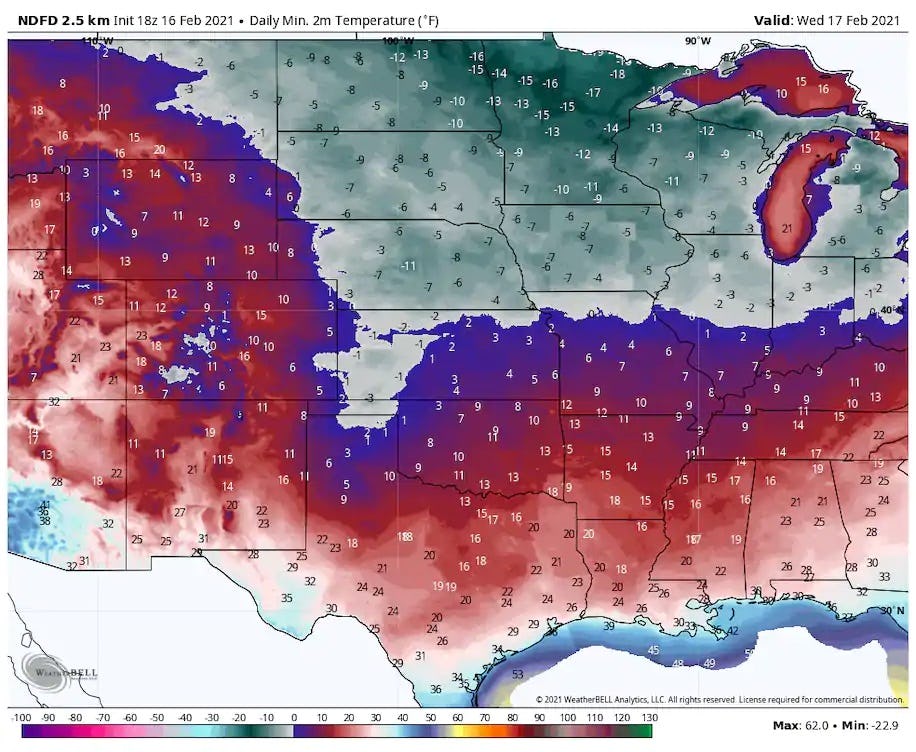
U.S. temperatures 17 February 2021 (Map of the Month March 2021)
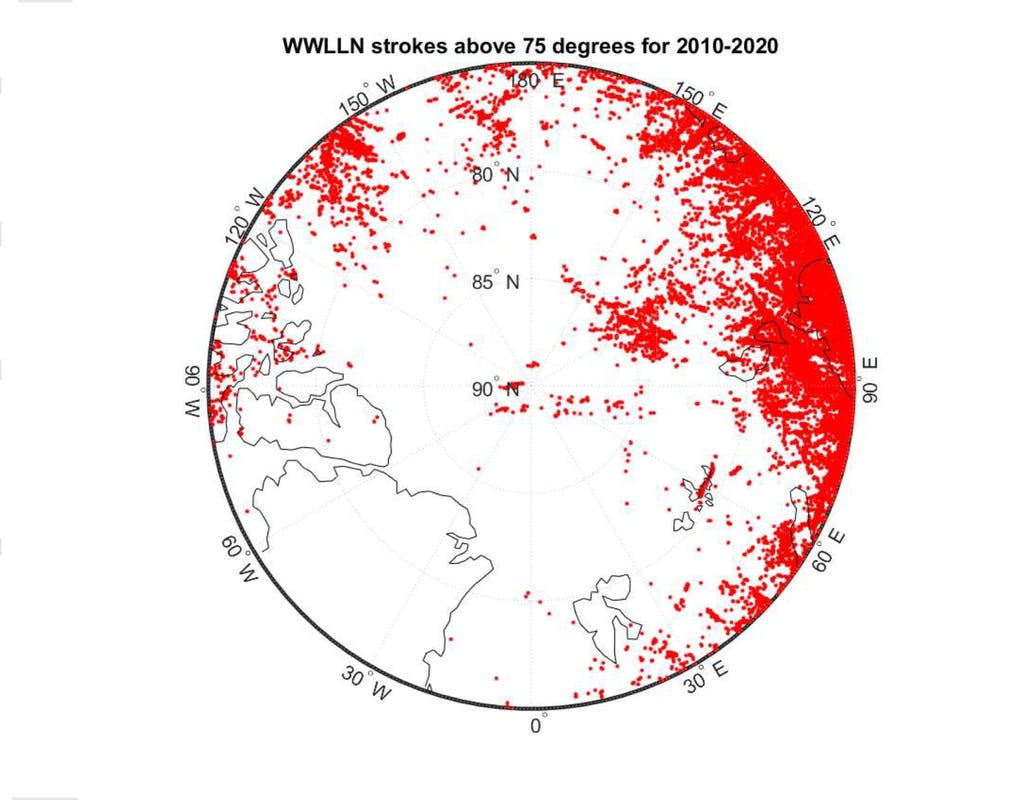
Lightning in the Arctic (Map of the Month April 2021)
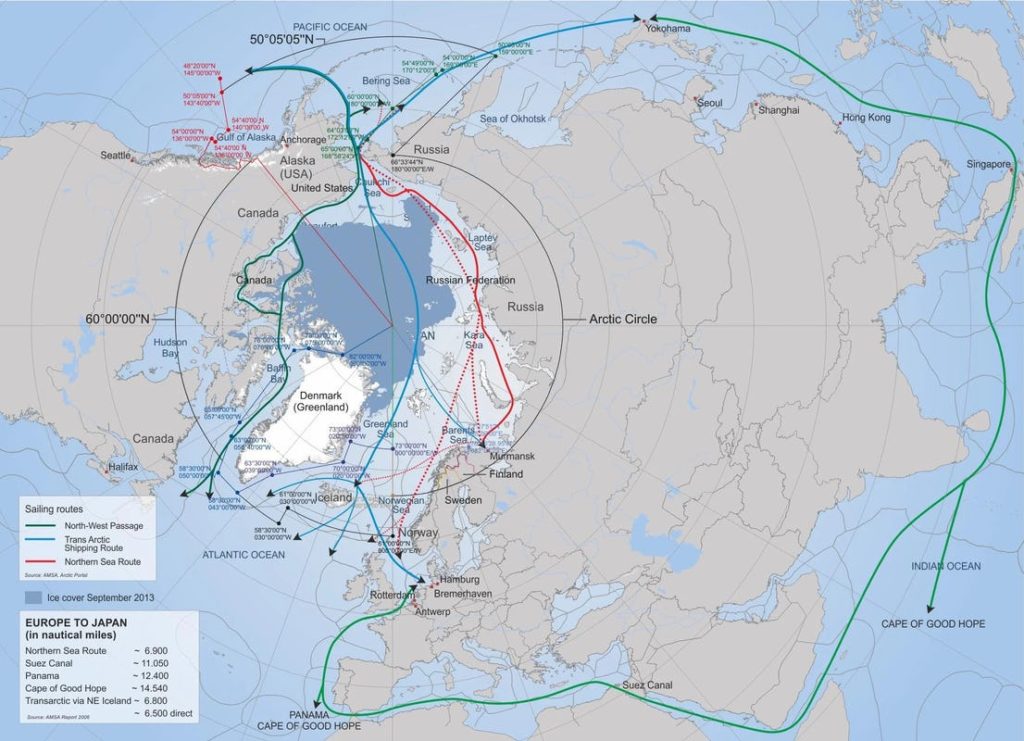
Suez Canal Route vs. Northern Sea Route (Map of the Month May 2021)
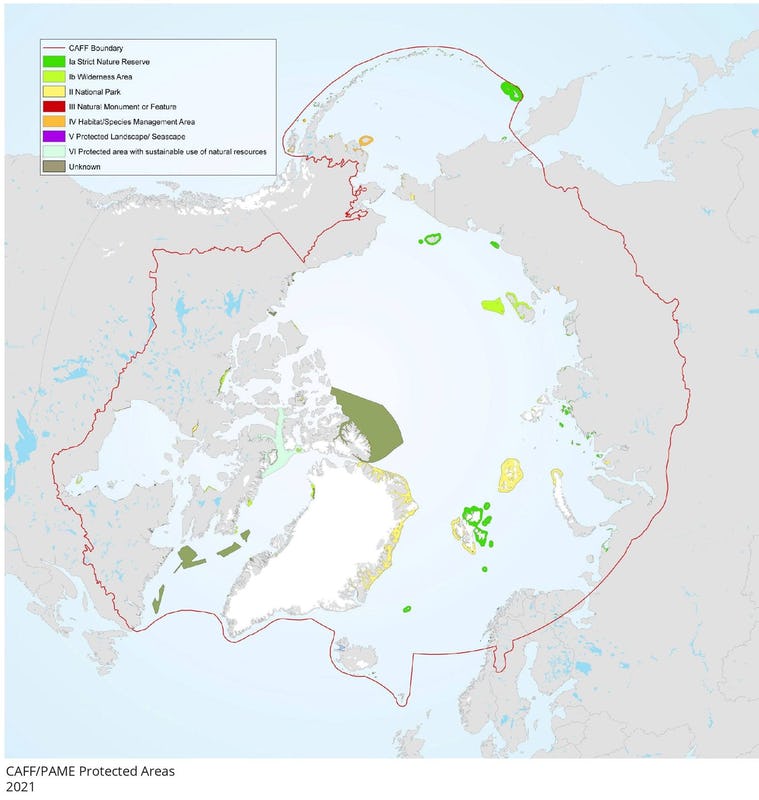
Marine Protected Areas in the Arctic (Map of the Month June 2021)
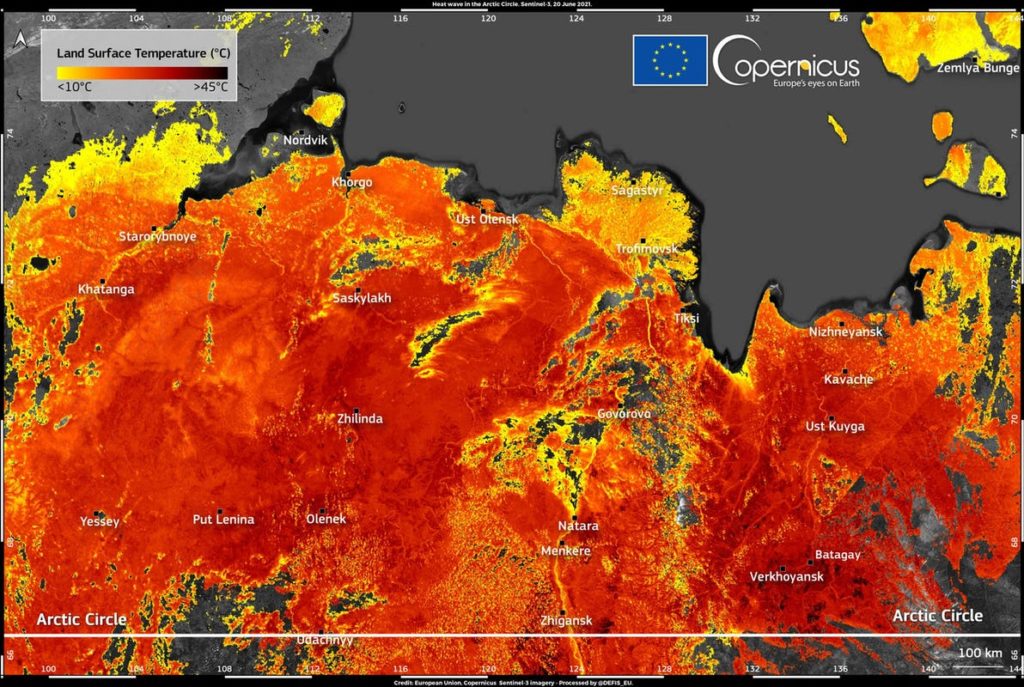
Land surface temperature in the Sakha Republic (Map of the Month July 2021)
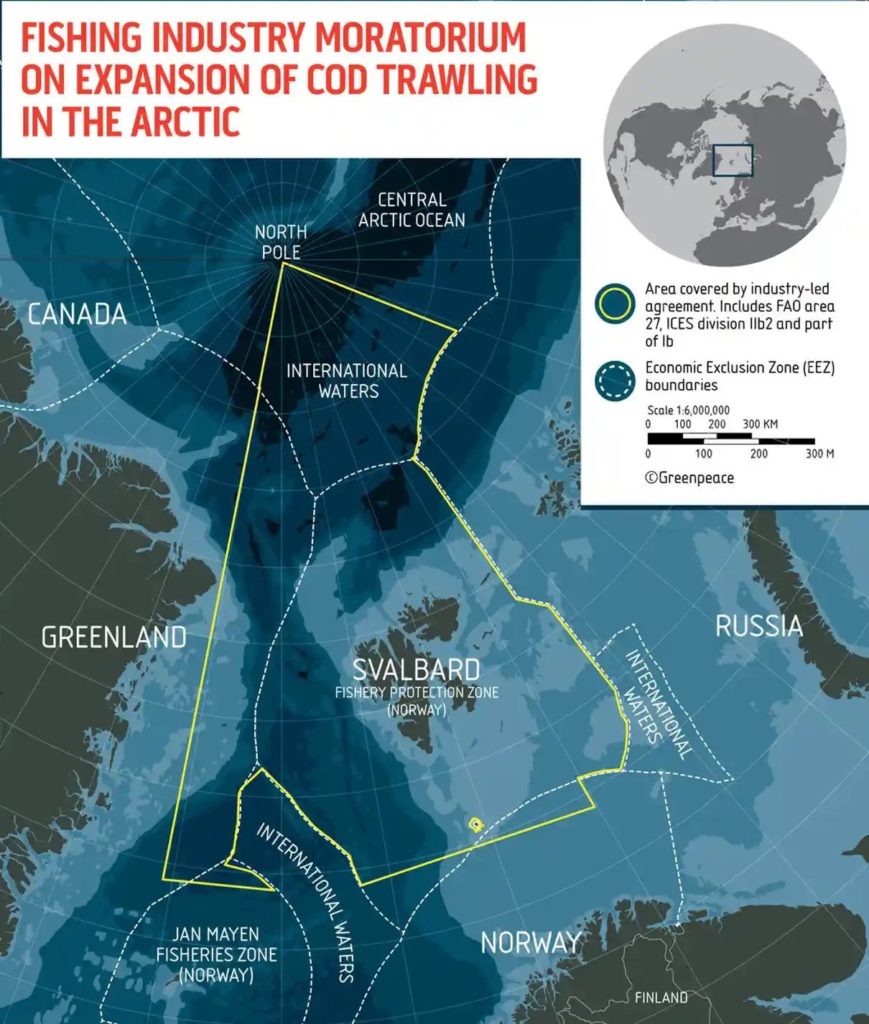
Northern Barents Sea (Map of the Month August 2021)
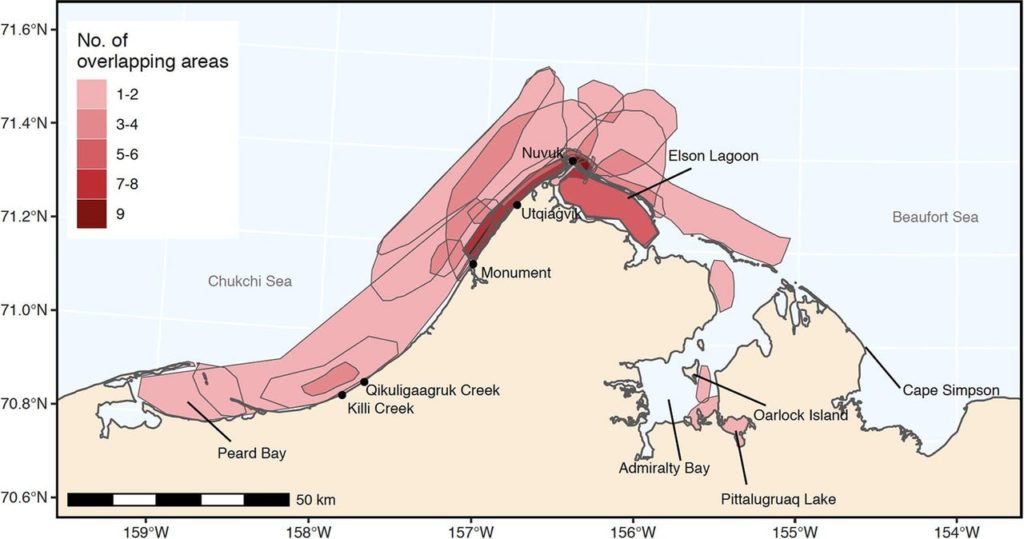
Ringed seal concentrations in the waters near Utiqiaġvik (Map of the Month September 2021)
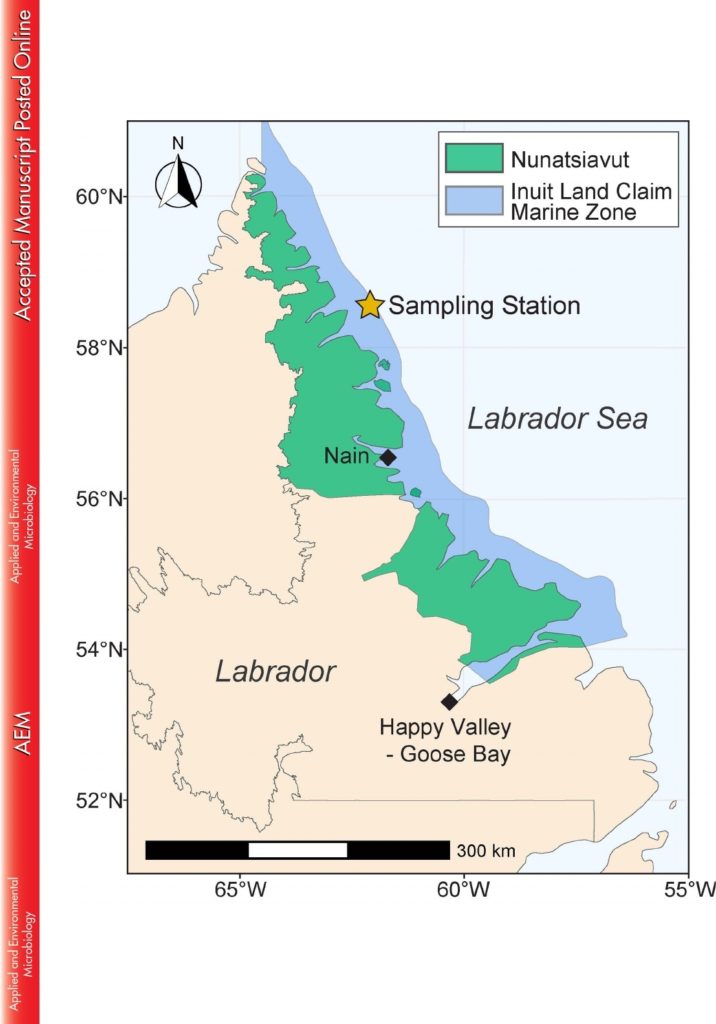
Biodegradation of cruide oil by microbial communities (Map of the Month October 2021)
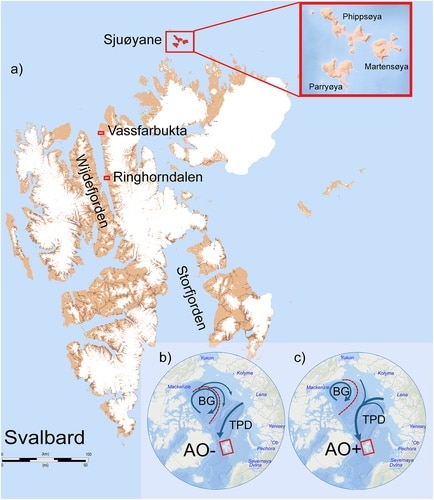
Arctic driftwood analysis reveals sea ice dynamics (Map of the Month November 2021)
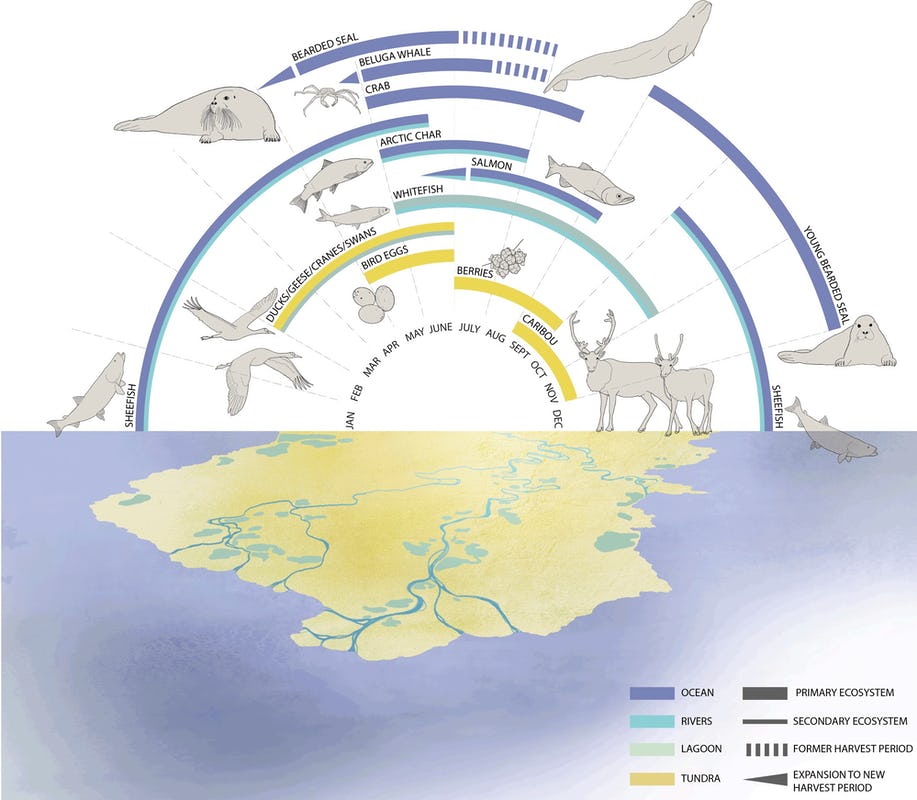
Seasonal changes in the harvest, Alaska (Map of the Month December 2021)