Icebergs and Navigation Safety in Antarctica: Possible Impact of new Sea-Ice Regime in the Southern Ocean and South Atlantic Ocean
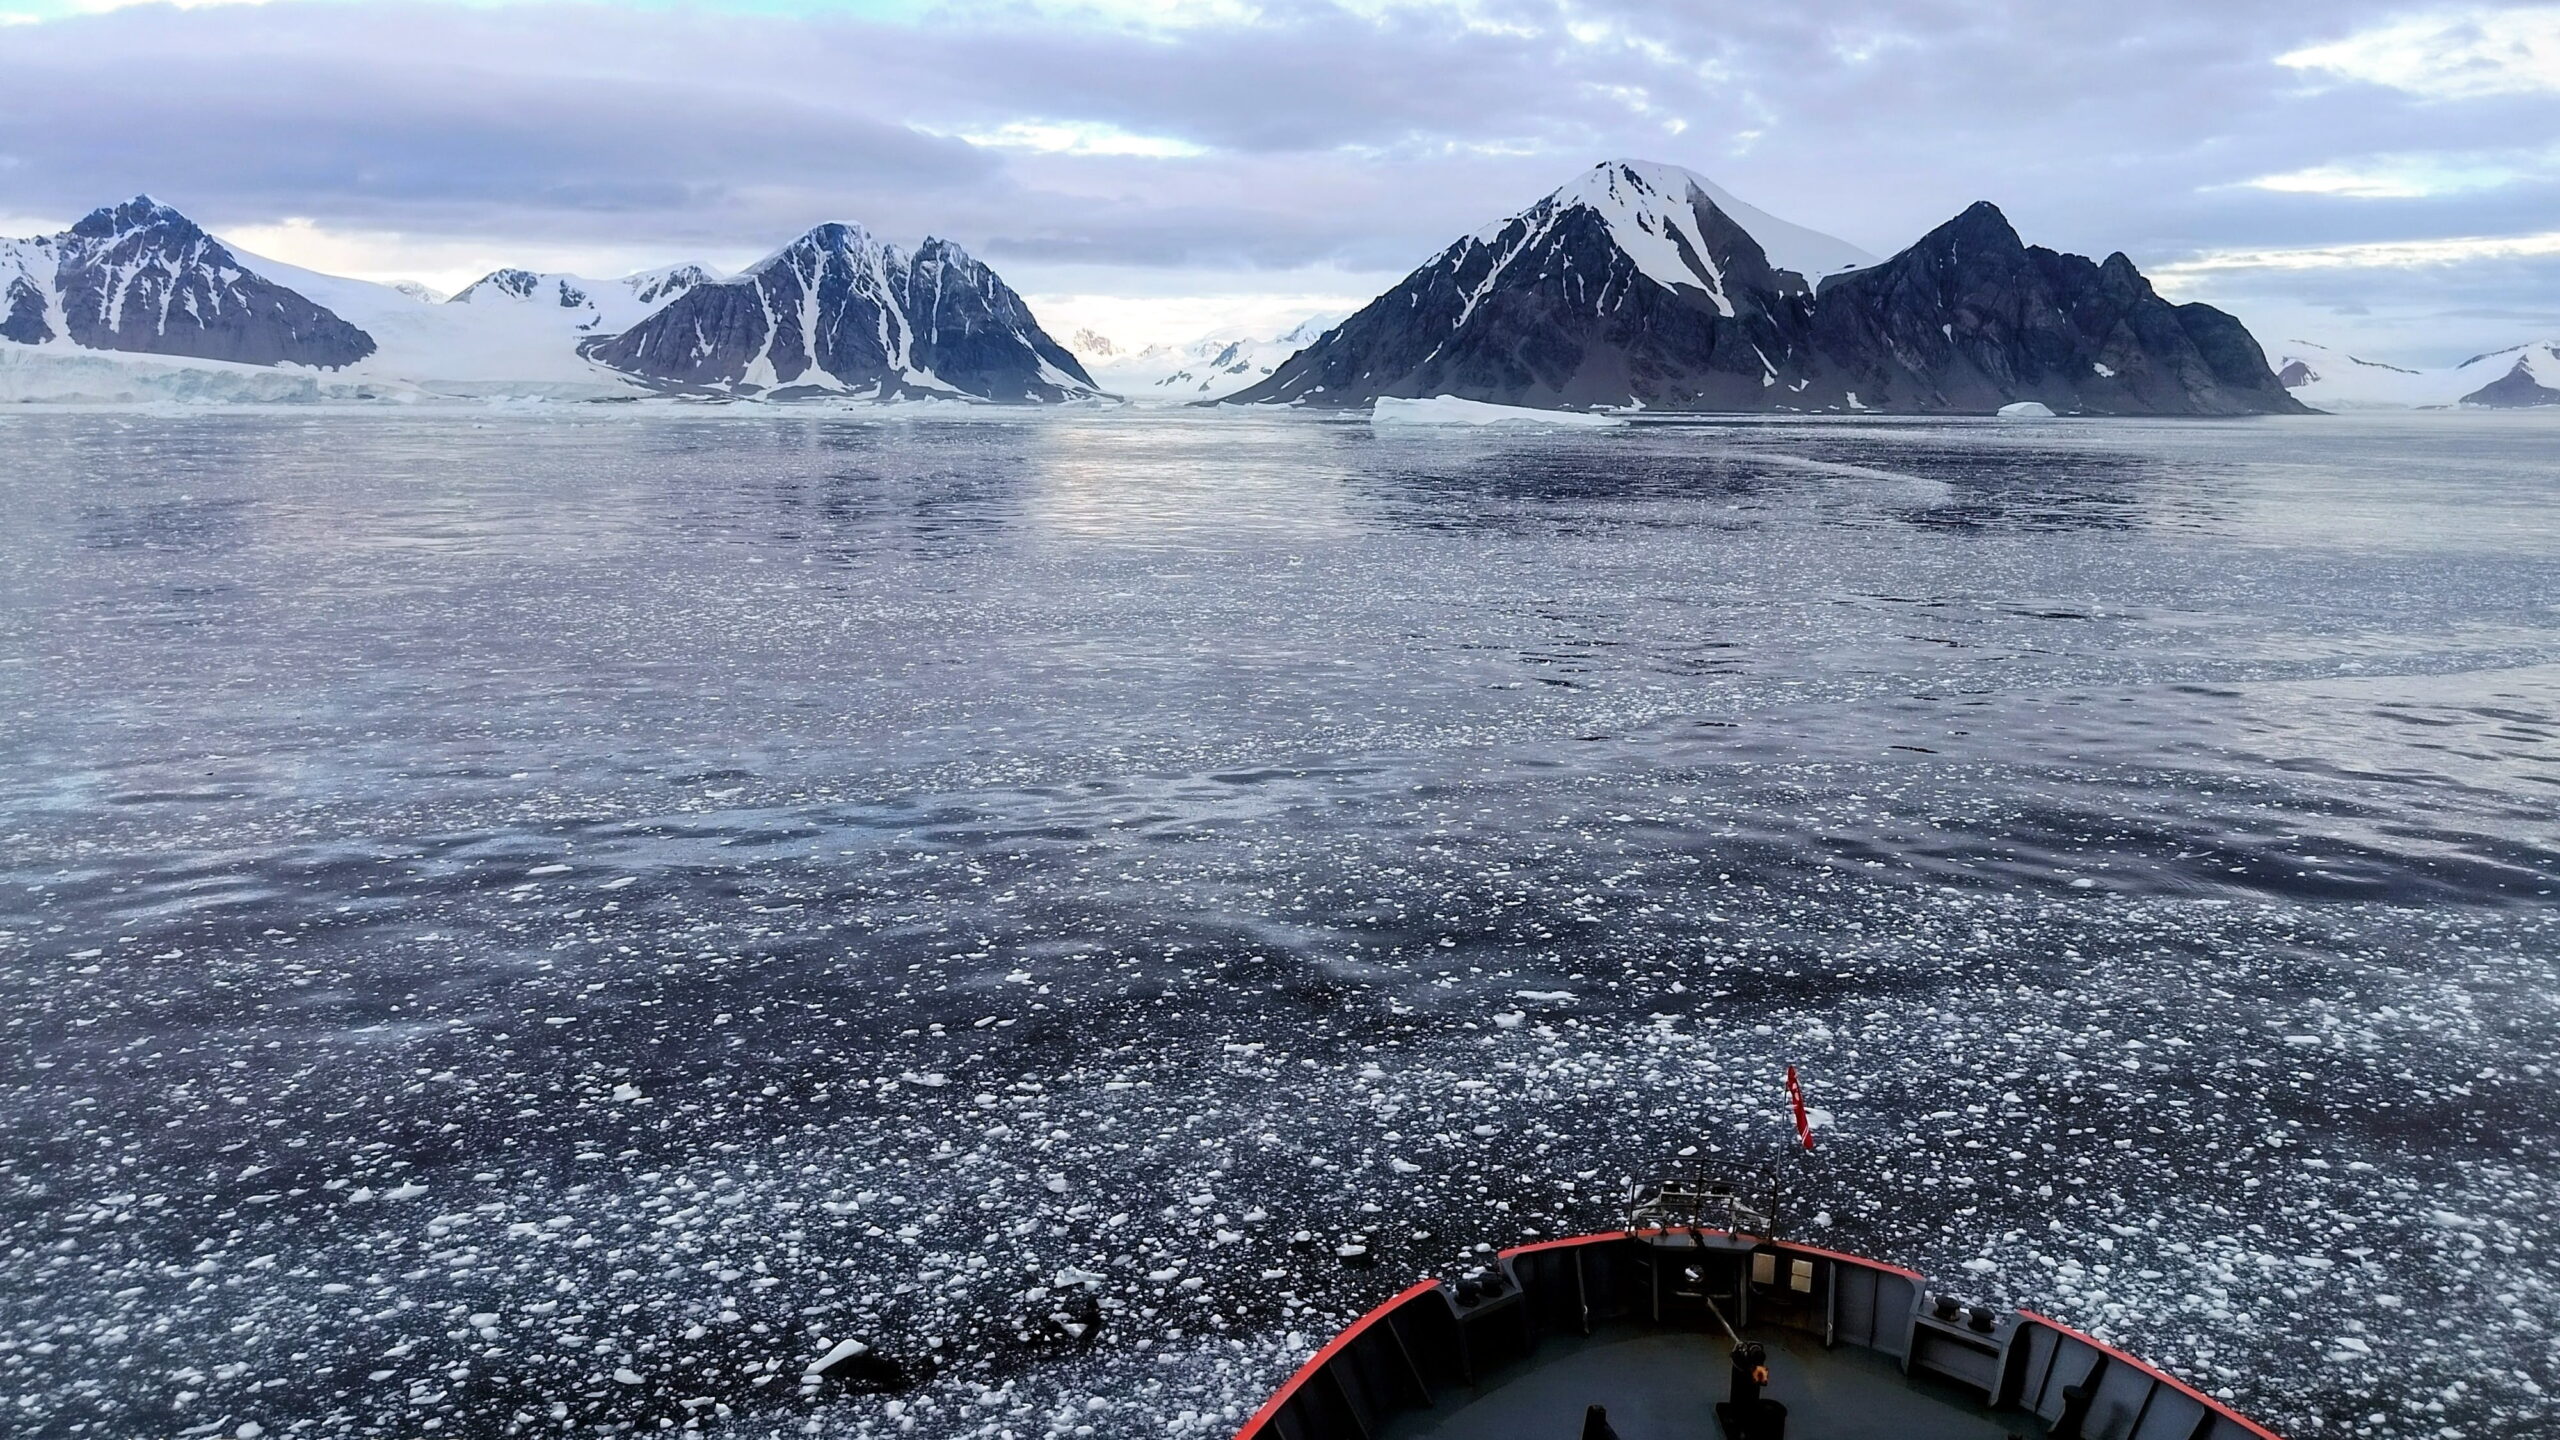
Sea ice and icebergs in the Antarctic Peninsula. Photo: Soledad Tiranti
The Arctic Institute Polar Disaster Series 2026
- The Arctic Institute’s 2026 Polar Disaster Risk Reduction and Response Series: An Introduction
- Crisis Management in Arctic Communities: Principles of Crisis Response
- Disaster Risk Reduction and Response: Greenland
- Risk Analysis of Infrastructure Vulnerability and Sustainable Resource Exploitation in the Arctic
- Ships in the Arctic Need to Plan to Survive Until Help Arrives
- From Pandemic to Permafrost: Legal Pathways for One Health Preparedness in Arctic Communities
- Icebergs and Navigation Safety in Antarctica: Possible Impact of new Sea-Ice Regime in the Southern Ocean and South Atlantic Ocean
- Legal Preparedness for One Health in Polar Regions: Strengthening Disease Surveillance
- A Framework for Avoiding Polar Disasters
- Keeping an Eye on Iceland: Volcanoes and Climate Change
- Choosing the Bear: Navigating Spectacular Risks in Longyearbyen
- Local Perspectives in Disaster Risk Reduction: Visualising Disaster Risk in Svalbard
- The Arctic Institute’s 2026 Polar Disaster Risk Reduction and Response Series: A Conclusion
Ship navigation in polar regions requires specialized skills and technology due to highly variable and uncertain conditions, making it riskier than standard navigation despite centuries of experience.1) Drifting icebergs can pose a risk to navigation as they are potentially dangerous if they collide with a vessel’s hull. Maritime activities, including commerce, fishing, and hydrocarbon exploration and exploitation, require reliable, accessible, and timely information about iceberg presence in their area of operations,2) especially considering navigation safety in Antarctica. For this reason, countries responsible for NAVAREA and METAREA coordination issue bulletins with iceberg position information along maritime commercial routes via satellite communications.
NAVAREAs and METAREAs are the regions into which the world ocean is divided for the dissemination of information related to navigational safety or weather forecast, correspondingly. These areas are part of the Global Maritime Distress and Safety System (GMDSS), established by the IMO (International Maritime Organization), the IHO (International Hydrographic Organization) and the WMO (World Meteorological Organization). Each NAVAREA/METAREA has a coordinating authority (usually a national service) that issues Notices to Mariners in its area. For example, Argentina is responsible for NAVAREA VI, which covers waters of the South Atlantic.
Nautical safety in polar and subpolar waters is conditioned by the presence of icebergs, making it essential to have accurate information about their positions and to plan safe navigation routes. Additionally, tourism in Antarctica has developed since the late 1960s, focusing mainly on attractions near the Antarctic Peninsula and adjacent islands. In the most recent period, tourist activity increased, with more than 120,000 visitors on over 50 vessels of various sizes and characteristics during the season from October 2023 to March 2024.3)
In this line of research, Eik and Gudmestad4) analyzed a case study on the impact of icebergs on offshore platform operations, establishing the need for a methodology to evaluate an iceberg management system and the efficiency of drift models.
Recent studies have analyzed the variability of sea ice surrounding Antarctica with findings referring to a possible regime shift characterized by sustained anomalous patterns in sea-ice extent and distribution. Notably, there is a trend toward historic minimums, as observed during the Antarctic winter by Purich and Doddridge, who identified ocean warming as a driving factor, suggesting a direct connection between rising ocean temperatures and reduced sea-ice extension.5)
Fogt et al. analyzed changes in the sea-ice extent regime throughout the 20th century based on ensemble reconstructions dating back to 1905.6) Using this methodology, the authors established a pattern of retreat across the entire Antarctic ice extent.
In the open waters of the Southern and South Atlantic Oceans, the main challenge for identifying and tracking icebergs is the scarcity of in situ observations. Therefore, monitoring relies on satellite data, specifically that obtained from Synthetic Aperture Radar (SAR) sensors. According to Salvó et al., this method is considered the most effective for detecting these objects at sea.7) This is due to the use of multiple acquisition bands and different resolution levels, which can reach up to 3 meters, as the sensors are not affected by cloud cover.
The objective of this work is to analyze the temporal evolution of the number of drifting icebergs in the South Atlantic Ocean and the adjacent area of the Southern Ocean, and to determine whether there is a relationship between iceberg presence in open waters and the extent of the sea-ice field.
Data and Methodology
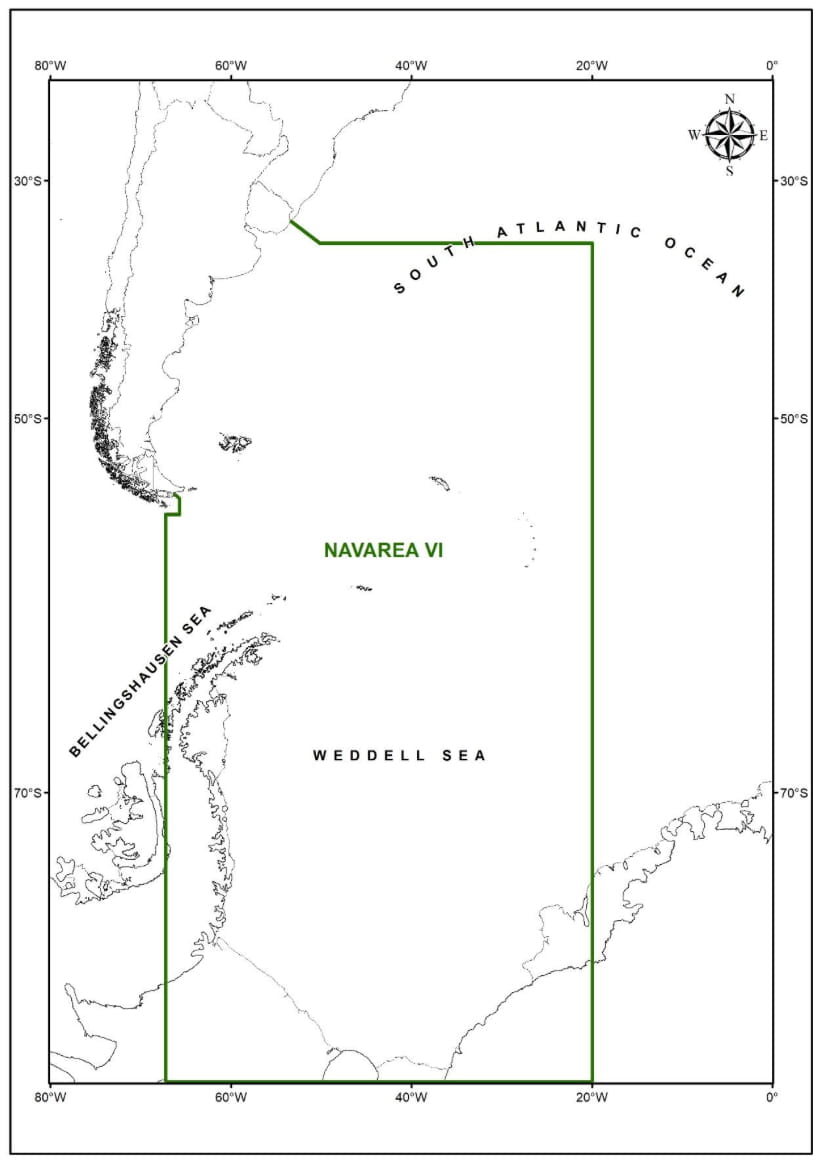
The study area corresponds to the NAVAREA VI, Argentina’s area of responsibility for issuing navigational warnings, called Aids to Mariners, concerning nautical safety and, in the case of this work, the presence of icebergs. This region includes the southwestern South Atlantic Ocean, part of the Southern Ocean, the Bellingshausen Sea, and the Weddell Sea, as shown in Figure 1.
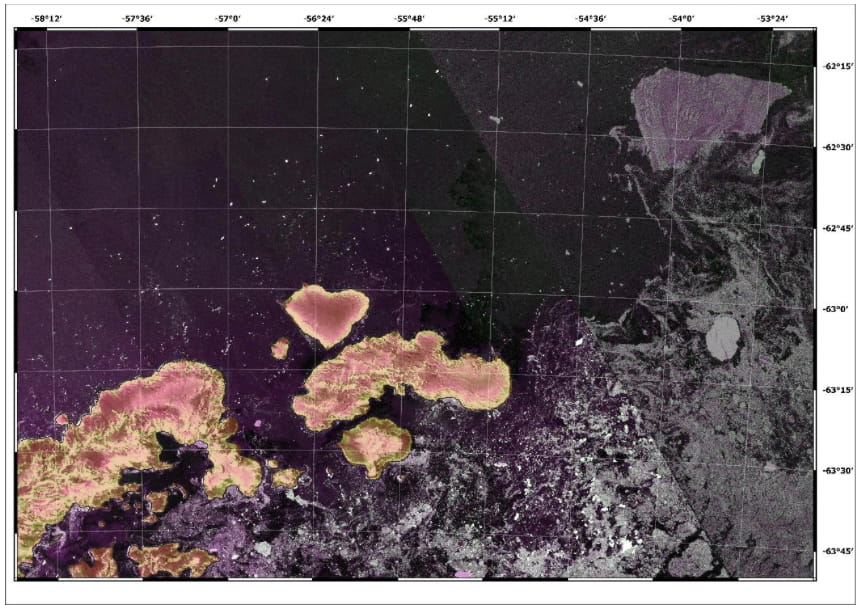
The data used were obtained from Synthetic Aperture Radar (SAR) sensors onboard the satellites of the SAOCOM constellation, operated by the Argentine Space Agency, Comisión Nacional de Actividades Espaciales (CONAE). Figure 2 shows an example of a radar image generated from these data, where icebergs of various sizes can be visually detected. The SAR sensor operates in the L-band microwave frequency (1.275 GHz). The analyzed images have a spatial resolution of 50 and 100 meters in TOPSAR Wide acquisition mode.
This study involved an analysis of changes in the sea-ice edge and iceberg concentration over a five-year period from 2020 to 2024. Between 30 and 40 SAOCOM images were analyzed for each sea-ice edge and each iceberg concentration study, totaling approximately 750 high-resolution satellite images. These images were processed using QGIS software (www.qgis.org). The visual analysis of satellite imagery is carried out by ice analysts trained in the interpretation of SAR data.8) The nomenclature and standards used to produce the ice charts described in this document follow the publication WMO Sea Ice Nomenclature: Volume I – Terminology and Codes, Volume II – Illustrated Glossary, and Volume III – International System of Sea Ice Symbols.9)
As previously mentioned, using various satellite images, the presence of sea ice is manually observed and delineated through the digitization of vector-format polygons. The analysis distinguishes between the compact ice edge and the marginal zone, which results from the seasonal expansion and retreat of sea ice. According to standardized nomenclature, the ice edge is the demarcation between sea ice of any kind and open water. Operationally, this definition is used for delineating the ice edge, and ice concentrations between 4 and 10/10 are also adopted as a criterion. Sea-ice concentration is expressed in tenths and represents the fraction of the surface covered by sea ice within a given area. Concentration is measured from 0 to 10 tenths, meaning 0/10: free water, no ice; 1/10: 10% of the surface covered by sea ice; 5/10: 50% covered by sea ice and 10/10: sea completely covered by ice, with no visible water.10)
Monitoring the quantity and drift of icebergs is conducted through visual interpretation of SAR images. In terms of radar signal interaction with objects, the data is captured in dual polarization (HHHV). Although iceberg detection is optimal in HV polarization, both HH and HV polarizations are analyzed simultaneously in a composite color radar image to improve discrimination between sea ice and icebergs, especially in cases where icebergs are embedded within the compact sea-ice field.
In this study, iceberg quantity is analyzed using a gridded system composed of cells measuring 1 degree of latitude by 1 degree of longitude. If a grid cell contains only one iceberg, it is classified as “isolated” (green cells); between 2 and 6 icebergs is classified as “few” (yellow cells); and 7 or more icebergs are classified as “many” (red cells). This method enables risk analysis based on iceberg presence, with severity increasing as more icebergs are visualized within a given cell. Figure 3 provides an example of this analysis using an overlay of SAR satellite images and cell classification based on iceberg quantity.
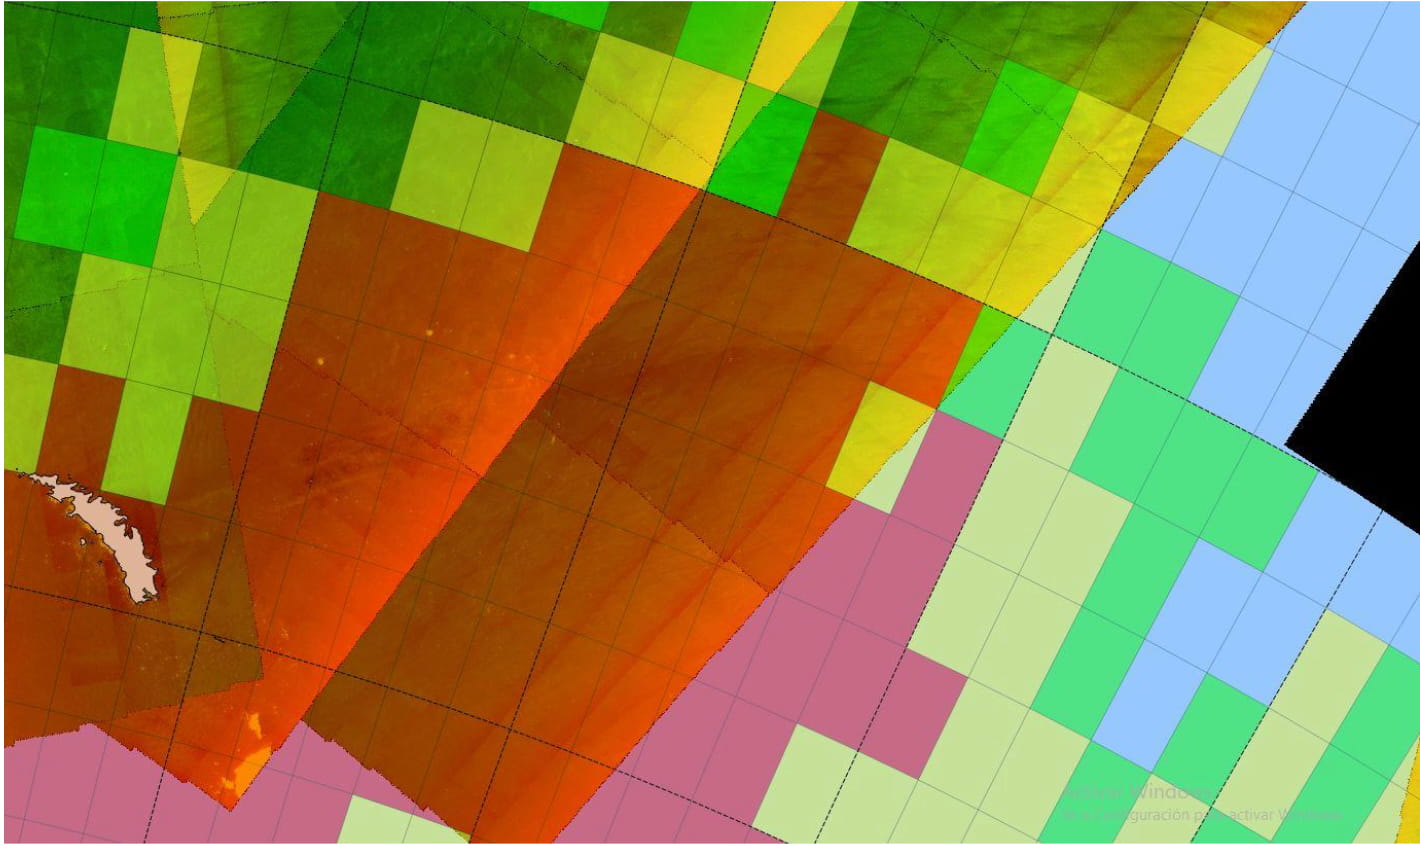
This risk-area approach optimizes the analysts’ operational time by providing essential detailed information for navigation safety in waters with high iceberg concentrations.
Results
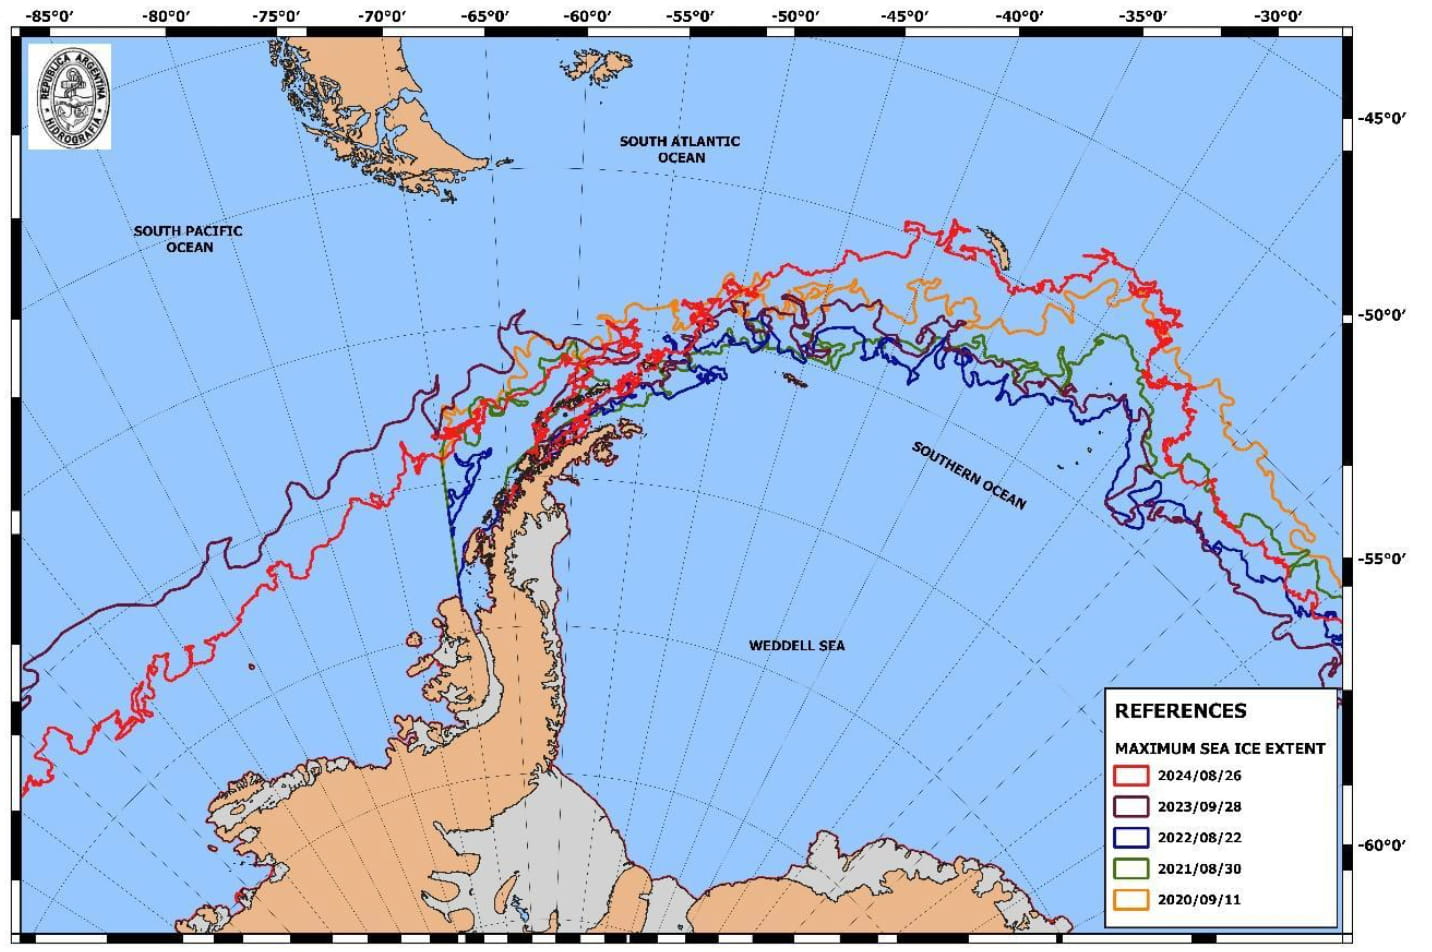
For the period of the last five years (2020 to 2024), the maximum and minimum sea-ice edges were analyzed based on SAR satellite data. Figure 4 shows the maximum extent edges for each of the analyzed years, which occur between the end of August and the end of September. For the region of interest, the minimum extent of the total sea-ice field during winter occurred in 2022.
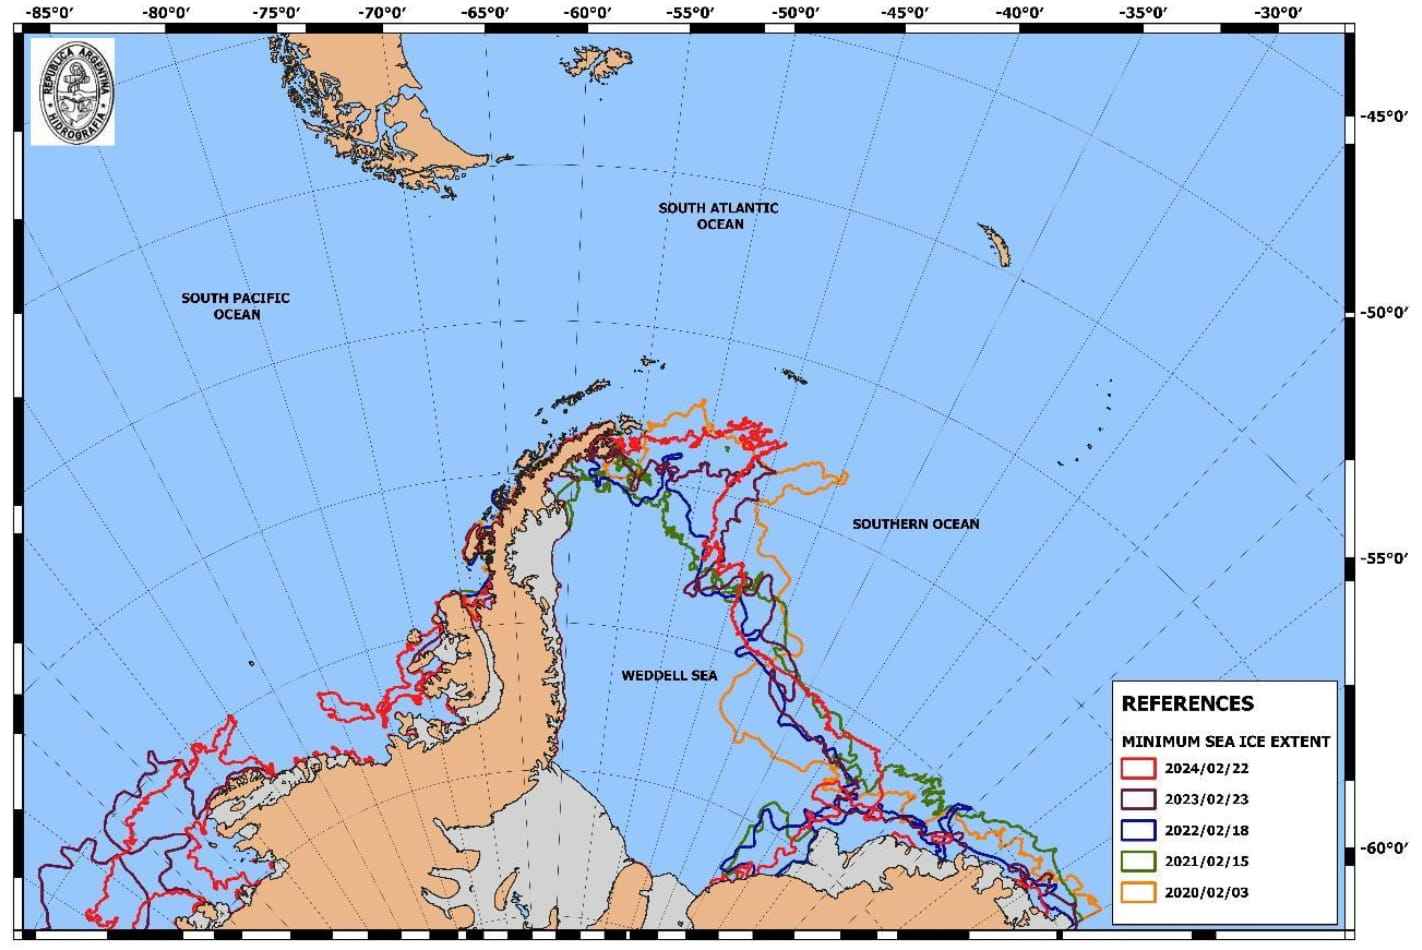
The minimum extent ice edges during the summer are shown in Figure 5 and occur throughout February each year. In this case, the year with the minimum summer extent is again 2022.
Although the lines delineating the ice edge vary slightly in position, the ranking from lowest to highest extent by year is: 2022, 2023, 2021, 2020, and 2024. This applies to both the maximum ice edge (winter) and the minimum (summer). It is important to note that for this region, the minimum ice-edge extent did not occur in 2023 as stated in the literature11) but should instead be considered a specific and local case.
Similarly, Figures 6 through 10 present the results of the iceberg presence analysis at their maximum northward extent for each of the years in the study period, considering only icebergs located outside the compact sea-ice field, i.e., north of the sea-ice edge. It is important to note that the peak occurrence of icebergs does not coincide with the same months across the years, indicating a heterogeneous temporal pattern.
The figures analyzed to determine the behavior pattern and quantity of icebergs in open waters, which may affect navigational safety, correspond to the time of year when icebergs drifted furthest north, i.e., toward lower latitudes.
From the analysis of these figures, it is observed that the number of drifting icebergs progressively increased over the years, and regarding the minimum latitude reached, the behavior is variable. For this period of the last five years, the northernmost position reached by icebergs was in 2023 (latitude: 42°S), followed by 2020 (43°S), 2024 (44°S), 2021 (46°S), and 2022 (49°S).
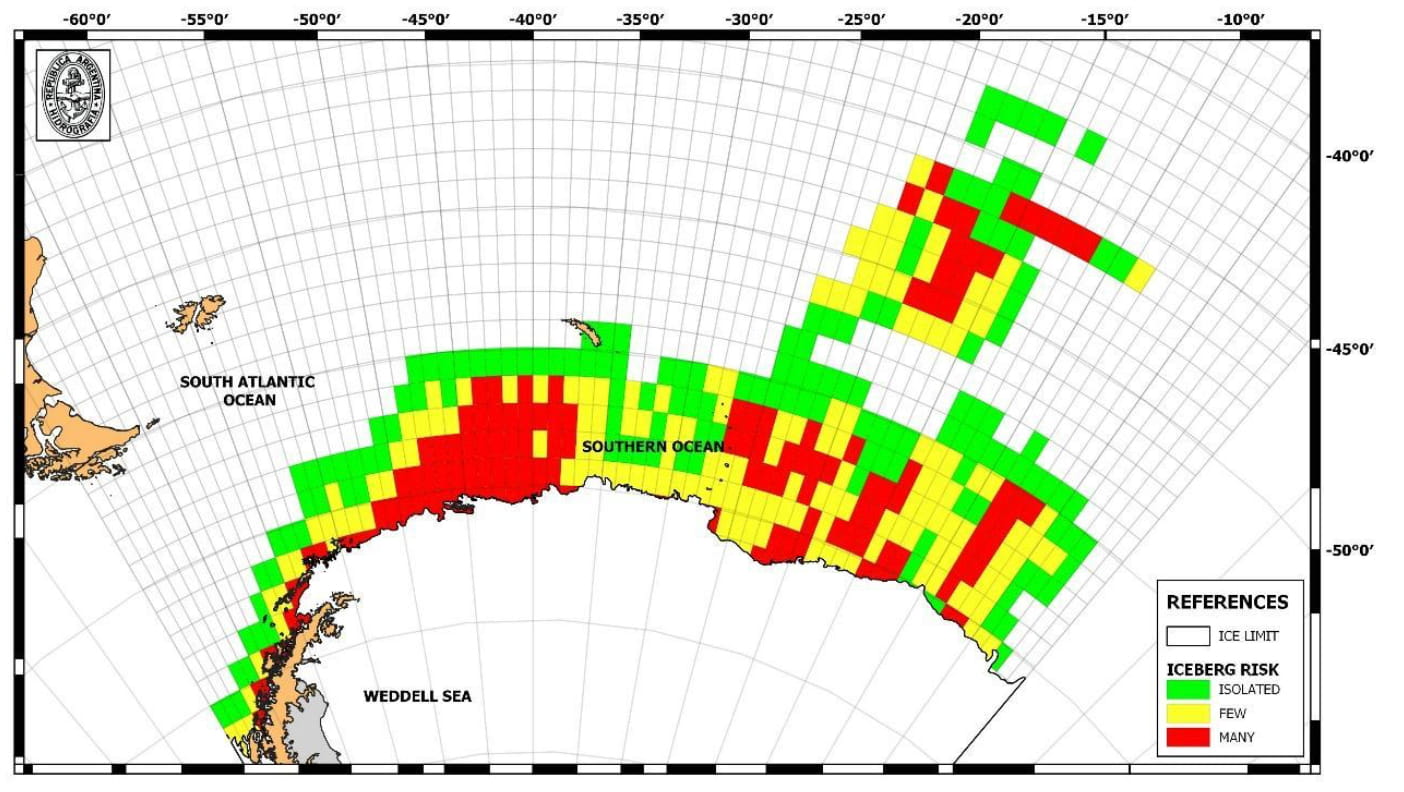
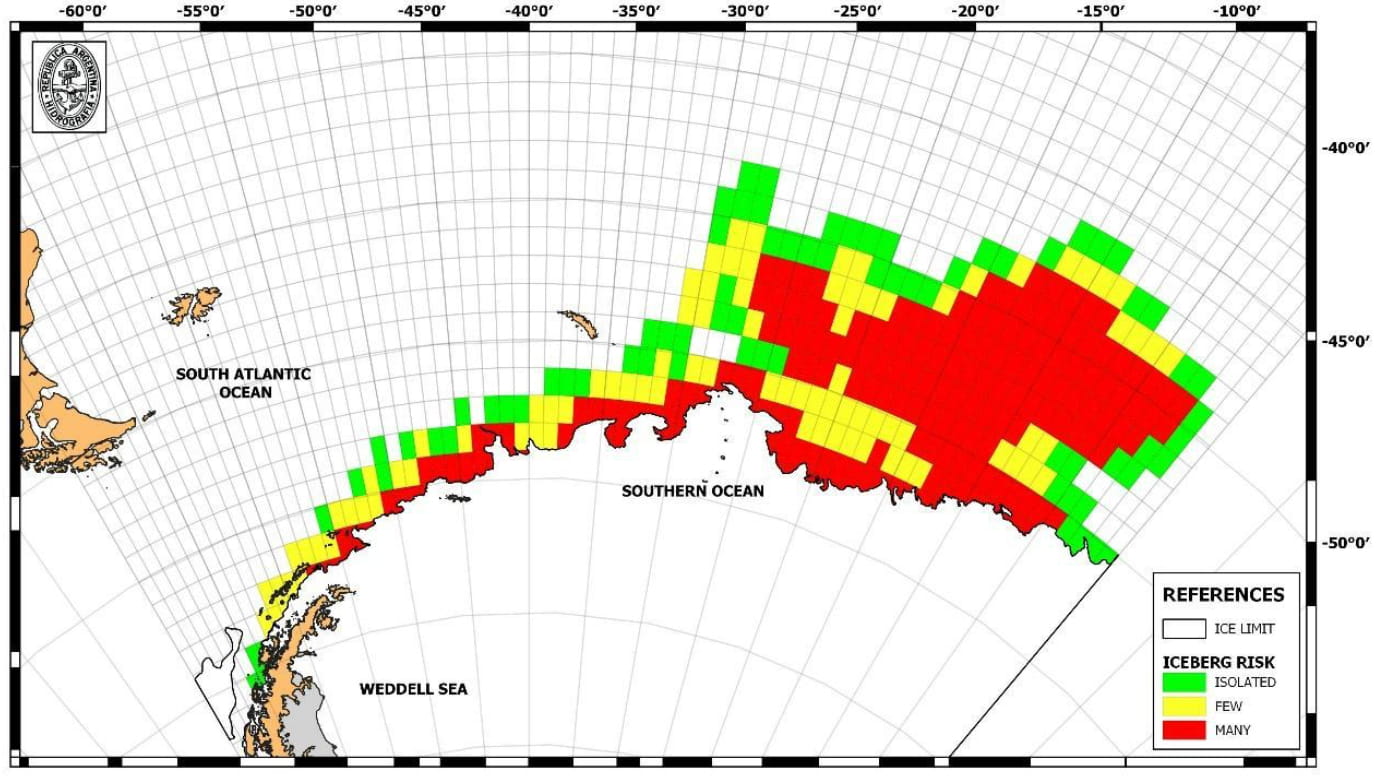
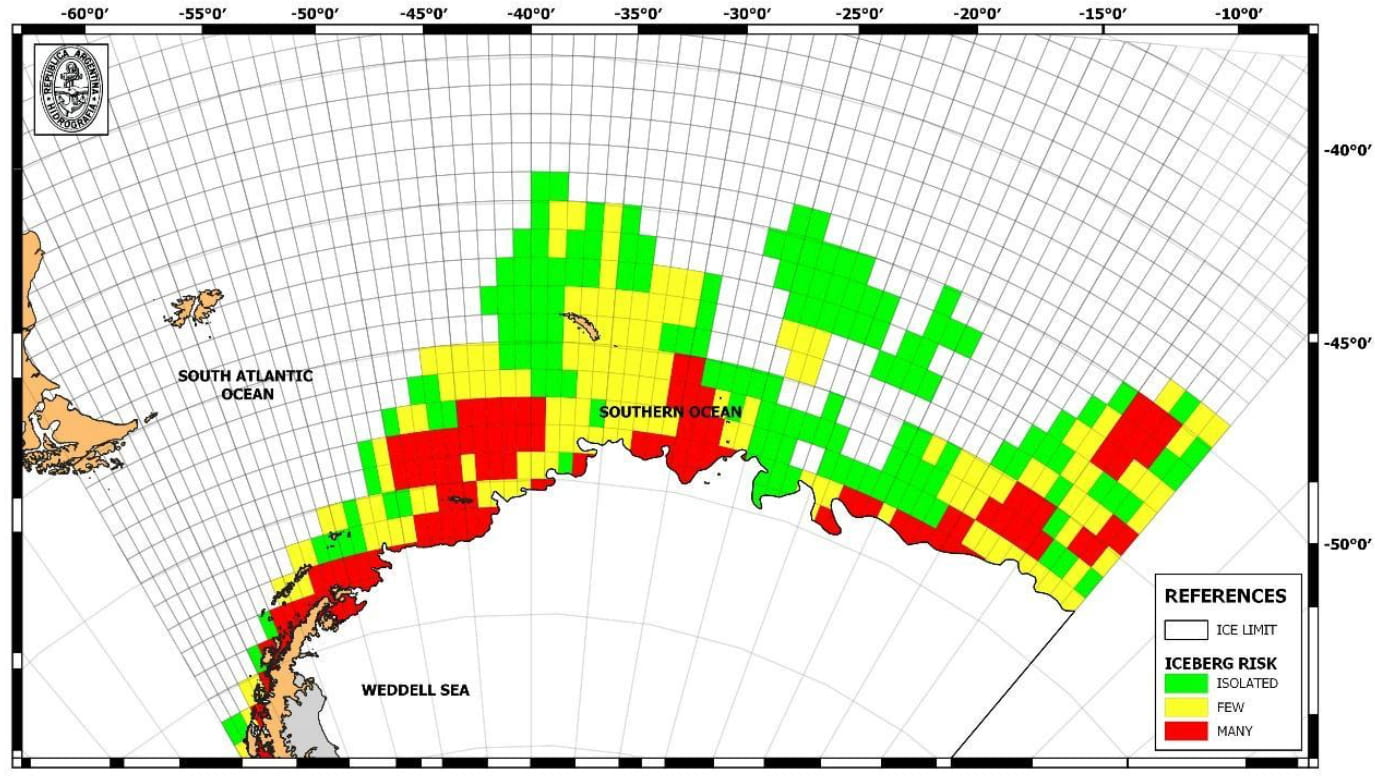
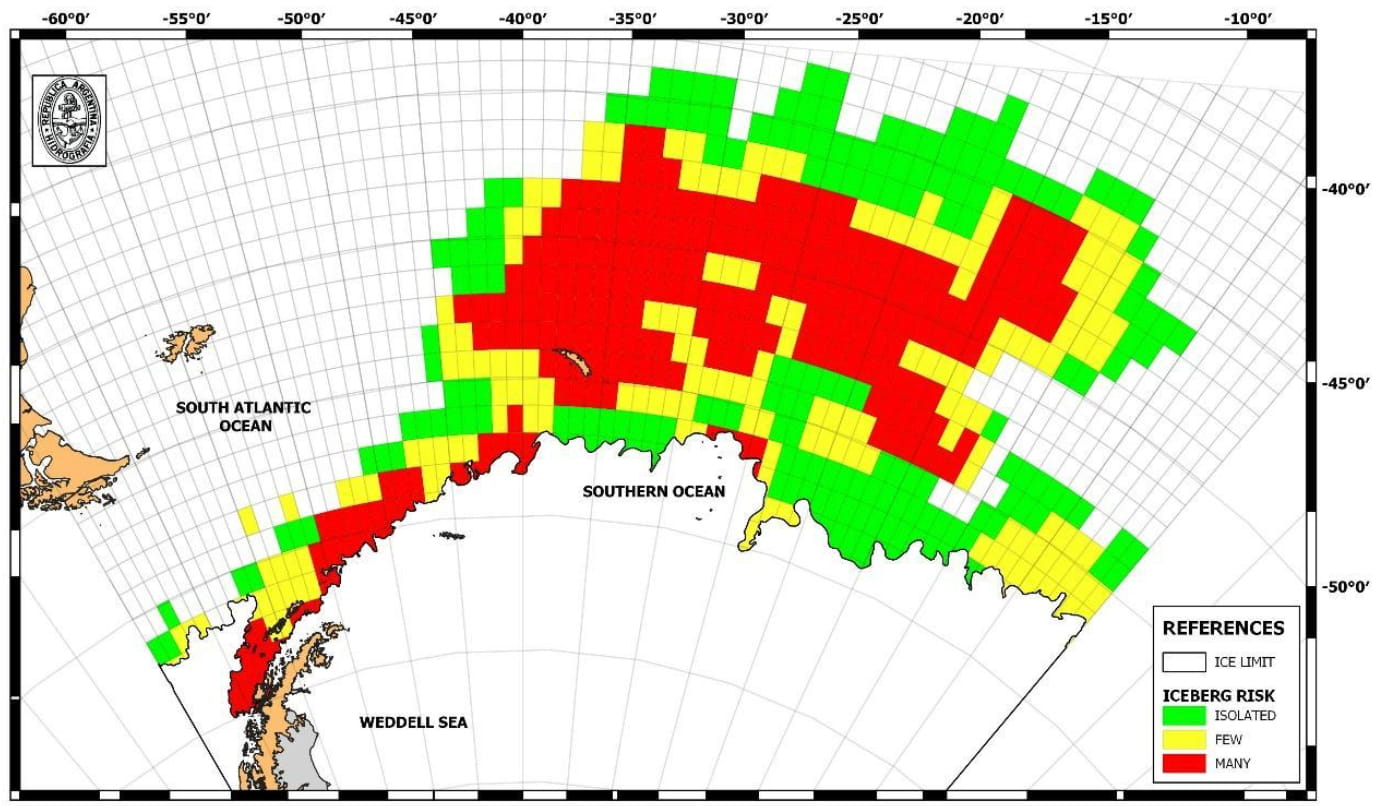
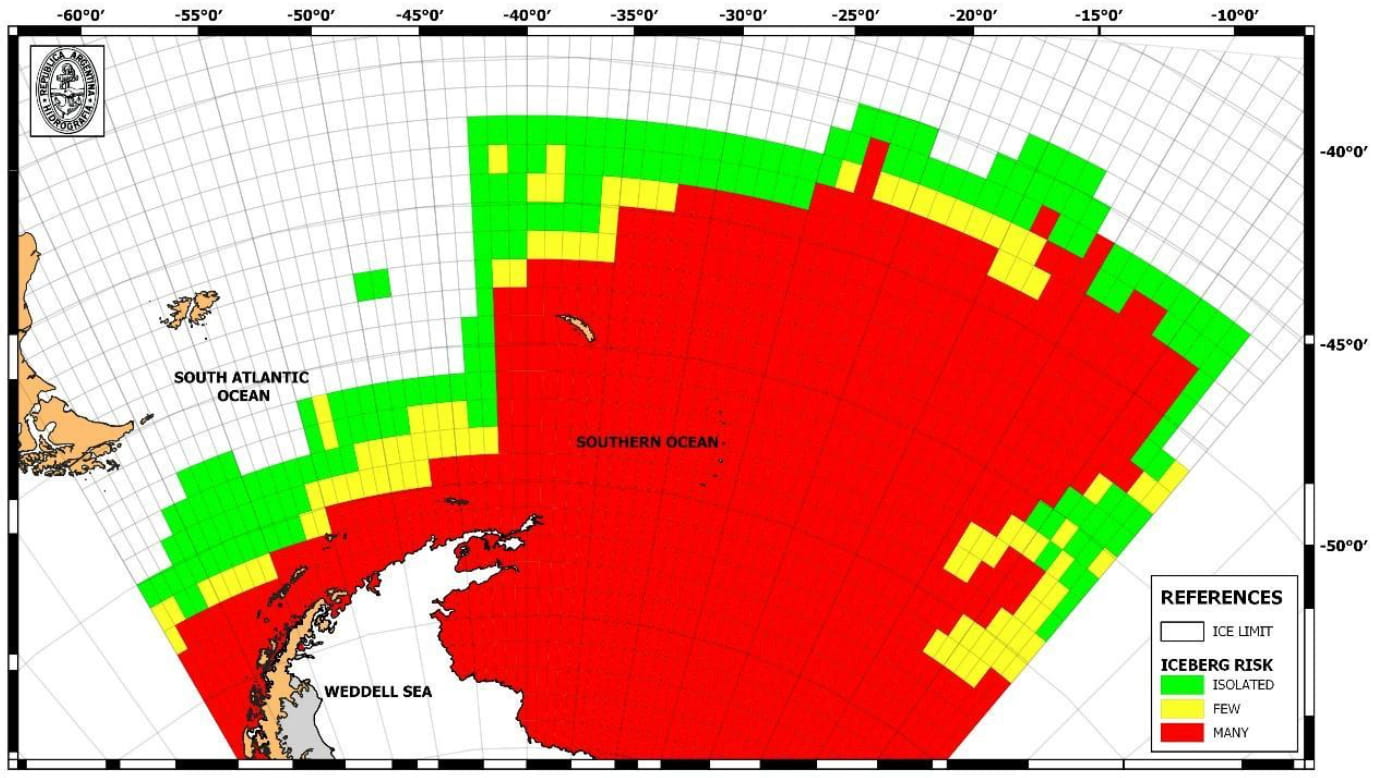
Based on the analysis of risk zones derived from the grid-cell iceberg counts, it can be determined that for the years selected in this study, there was an increase in both the number of cells and the total number of icebergs. The results of these counts are presented in Tables 1 and 2.
| Number of icebergs | ||||
|---|---|---|---|---|
| Isolated | Few | Many | Total | |
| 2020 | 143 | 864 | 1030 | 2037 |
| 2021 | 68 | 474 | 1470 | 2012 |
| 2022 | 147 | 876 | 840 | 1863 |
| 2023 | 179 | 942 | 2220 | 3341 |
| 2024 | 184 | 594 | 7500 | 8278 |
Table 1 shows the number of grid cells where icebergs were observed, categorized by density or risk. Although there are no significant differences between the “Isolated” and “Few” categories, there is a clear increase in cells classified as “Many” indicating a progressive rise over time in total values. Figure 11 illustrates this temporal pattern.
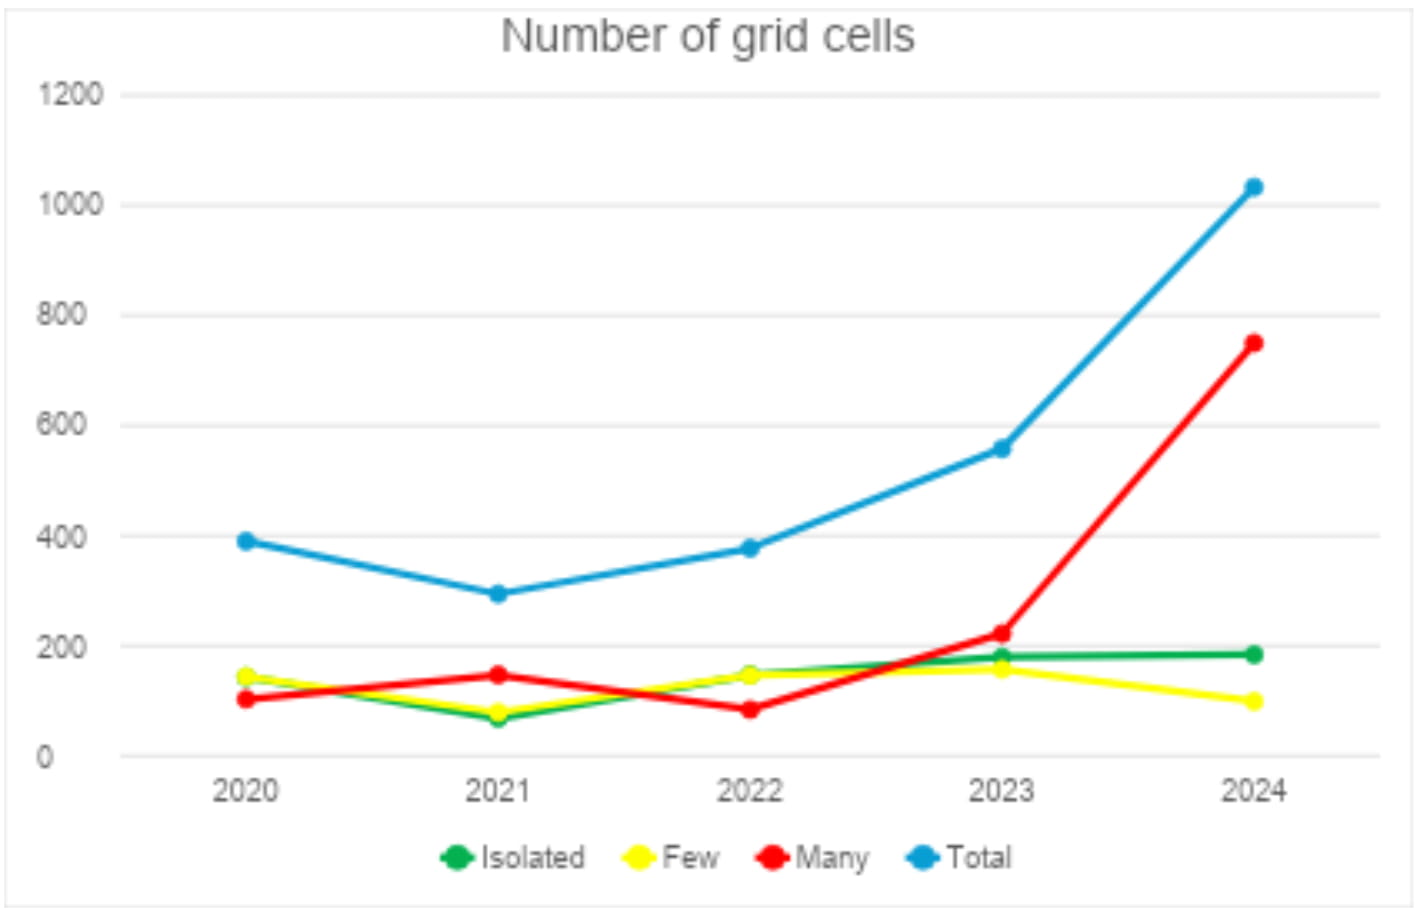
Similarly, Table 2 presents the iceberg count per cell type according to the risk classification (“Isolated,” “Few,” and “Many”), again confirming a significant increase in total values. The time series is shown in Figure 12.
| Number of grid cells | ||||
|---|---|---|---|---|
| Isolated | Few | Many | Total | |
| 2020 | 143 | 144 | 103 | 390 |
| 2021 | 68 | 79 | 147 | 294 |
| 2022 | 147 | 146 | 84 | 377 |
| 2023 | 179 | 157 | 222 | 558 |
| 2024 | 184 | 99 | 750 | 1033 |
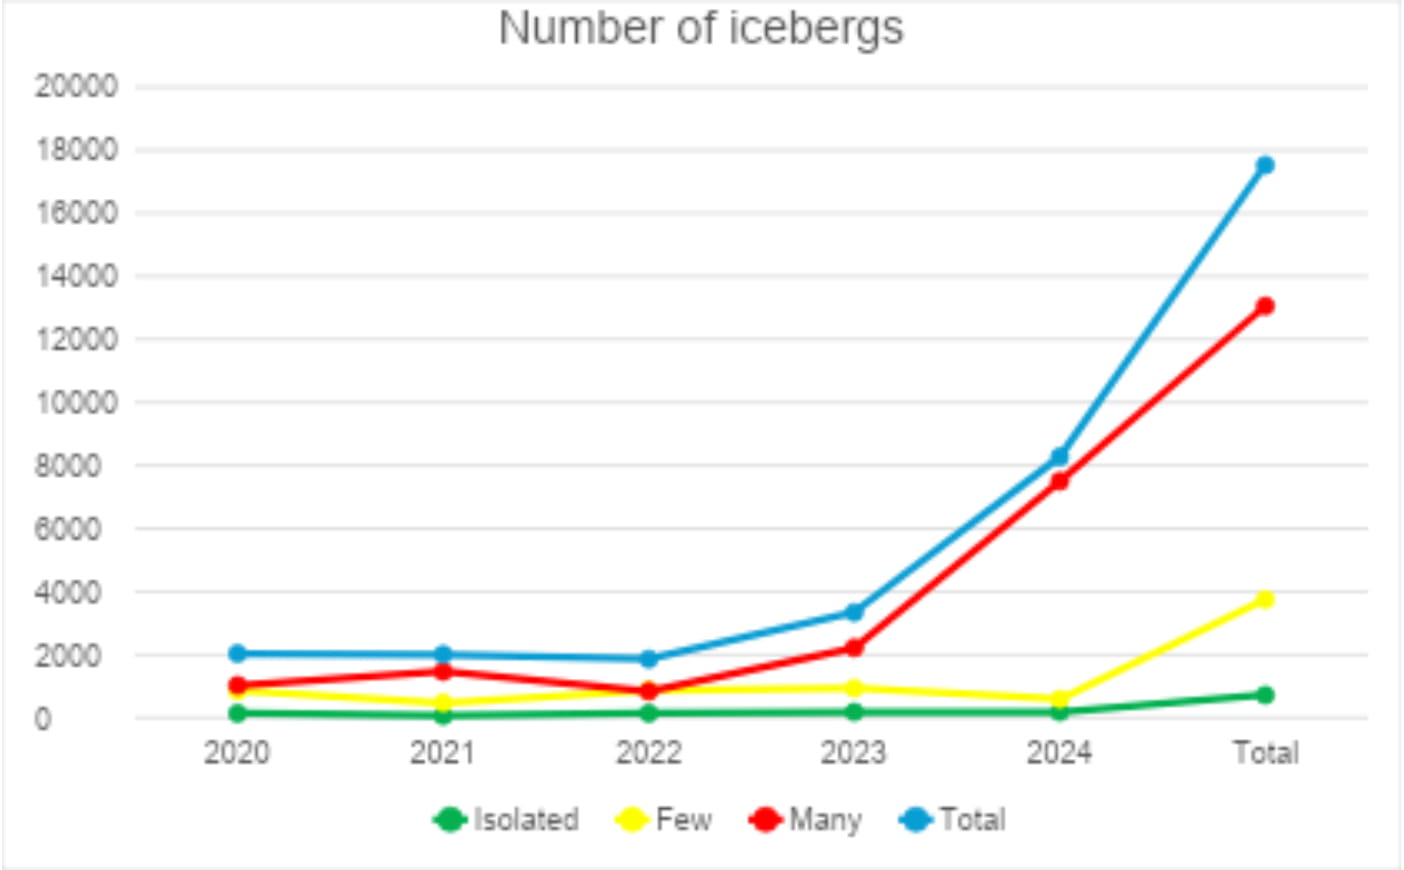
For both methods of counting iceberg presence — by the number of cells or by numerical count of each element — it is determined that from 2022 onwards, there has been a notable increase in iceberg presence in the study region.
Conclusions
It has been determined that there is a significant increase in the number of drifting icebergs during their peak northward drift, both in the Southern Ocean and the South Atlantic Ocean. This increase is evident in the iceberg counts as well as in the number of cells in the risk-zone grids. This classification method for identifying areas with iceberg presence proves to be highly useful for the proper interpretation of potentially hazardous zones.
Although the study region has experienced a progressive decrease in the extent of the sea-ice field—both for the winter maximum and the summer minimum—the year with the lowest extent was 2022, not coinciding with global analyses for all of Antarctica, which identified 2023 as an extreme minimum event.
It is possible that the increasingly reduced extent of the sea-ice field over the last five years plays an important role in the rise of the number of drifting icebergs in open waters, as icebergs lose their usual containment and remain adrift longer under the influence of ocean currents and wind. This is a preliminary result and must be further studied as more years of data become available to evaluate the progression of the sea-ice field and the positions of icebergs in the Southern and South Atlantic Oceans.
Given that the study region has a high density of maritime traffic—commercial, fishing, and especially tourism, which increases every year—it is crucial to understand the evolution of iceberg quantity and position.
Additionally, crew vessels navigating north of the Drake Passage, where a notable increase in iceberg presence has been detected, are typically not familiar with the presence of these objects in their routes and are not prepared for such navigation conditions. This means that many ships are not polar prepared in terms of hull reinforcement or readiness for sailing in ice-infested waters. For Ice Services, the presence of icebergs in subpolar waters represents a compromise for better and more accurate information for safety of navigation.
Understanding the relationship that may exist between a new sea-ice extent regime and the increase in iceberg presence is fundamental for designing products and tools that support the provision of navigational safety information services. It is critical to avoid contact between ship hulls and icebergs to prevent potential damage, environmental consequences, or even loss of human life.
Alvaro Scardilli is the head of the Meteorology Department at the Naval Hydrographic Service of Argentina. The authors wish to thank the Comisión Nacional de Actividades Espaciales (CONAE) for providing SAOCOM satellite images, especially Laura Frulla, Alvaro Soldano, and Mario Camuyrano for their tireless support in the development of knowledge on sea ice and icebergs.
References